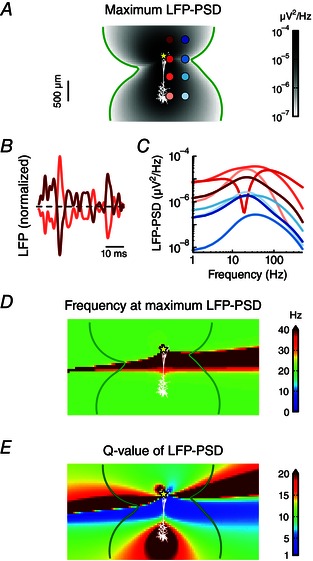
Figure 6. Resonance in the LFP resulting from a restorative conductance is a spatially stable feature .

A, apical white‐noise current input (yellow star) is provided to the cortical pyramidal cell model with a single quasi‐active conductance with increasing density with distance from soma. The resulting LFP‐PSD was calculated at a dense 2D grid surrounding the cell. The maximum power of the LFP is denoted in shades of grey. The green contour line shows where the LFP power is 10–7 μV2 Hz–1. B, excerpts of LFP time traces at two extracellular positions, corresponding to the two electrodes at the opposite side of the zero crossing region of the dipole in A (i.e. the first and third electrode contact in the left column). C, LFP‐PSD computed at the eight electrode positions marked by shades of red and blue in A. D, the frequency for which the LFP‐PSD shows the maximum power (see A). E, the Q‐value of the LFP‐PSD, defined as the maximum power (see A) divided by the power at 1 Hz.
