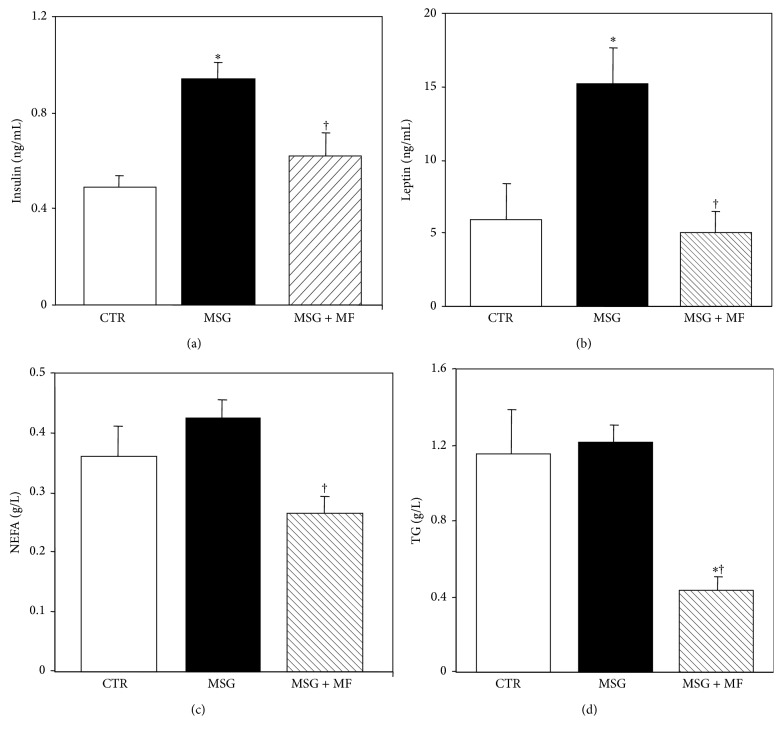
Figure 3.
Circulating levels of markers of the adipoinsular axis function: insulin (a), leptin (b), nonesterified fatty acids (NEFA) (c), and triglycerides (TG) (d), in normal (CTR), MSG, and metformin-treated MSG (MSG + MF) male rats at 90 days of age. Values are means ± SEM (n = 8 rats per group). † P < 0.05 versus MSG values. ∗ P < 0.05 versus CTR values.

