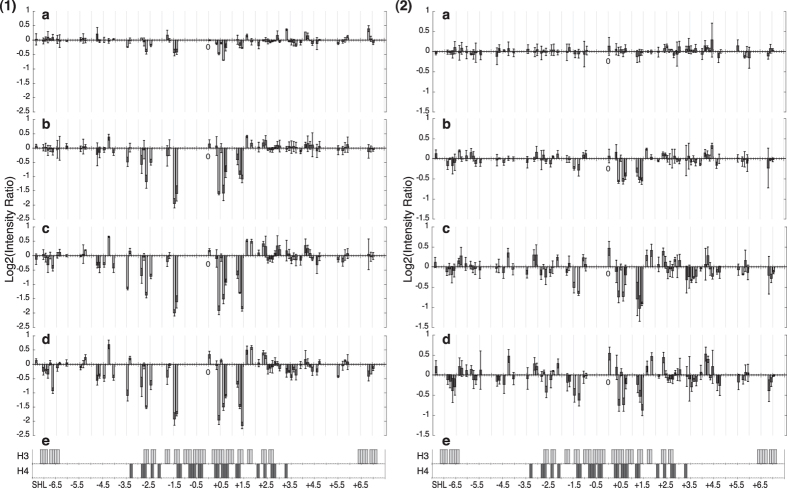
Figure 5.
Snapshots during nucleosome reconstitution with histone (H3/H4)2 tetramer in (1) the 601 sequence and (2) the 601.2.4 sequence. The histogram represents log2 of the intensity ratios of the peak height for Y-Y dimer peaks at a specific ionic strength for reconstituted DNA compared with free DNA. (a) Peak height ratio of DNA alone to reconstituted DNA in 1.5 M (a), 1.0 M (b), 0.5 M (c) and 0.25 M (d) NaCl buffer during the salt dilution process. Error bars derive from SD of three separate experiments. (e) DNA regions involved in the interface with the structured part of each histone in the complete nucleosome. Note that the y-ranges of panels (1) and (2) differ.

