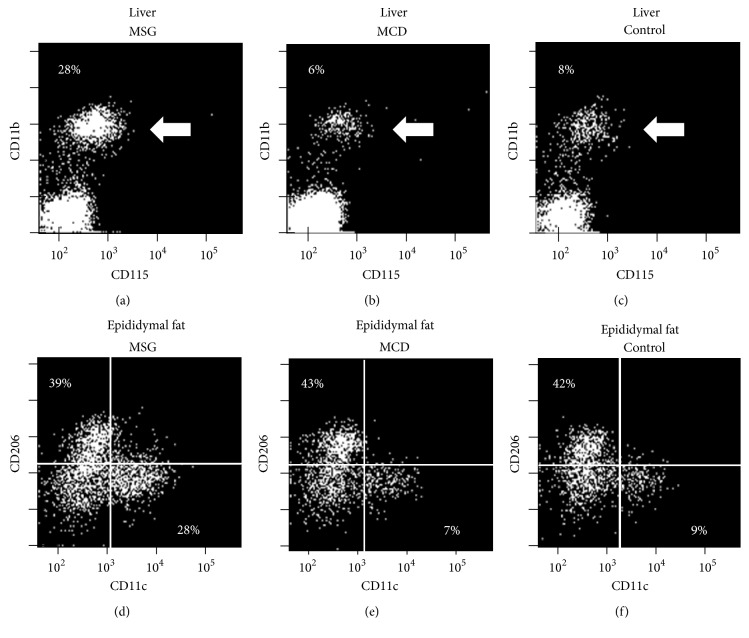
Figure 4.
Frequency of monocytes among hepatic mononuclear cells and the frequency of macrophages among the cells in the stromal vascular fraction at 18 weeks. Representative dot plots of the monocyte (arrow), M1 macrophage, and M2 macrophage subpopulations are shown. All samples were triplicated, and data for one representative mouse per group are shown.

