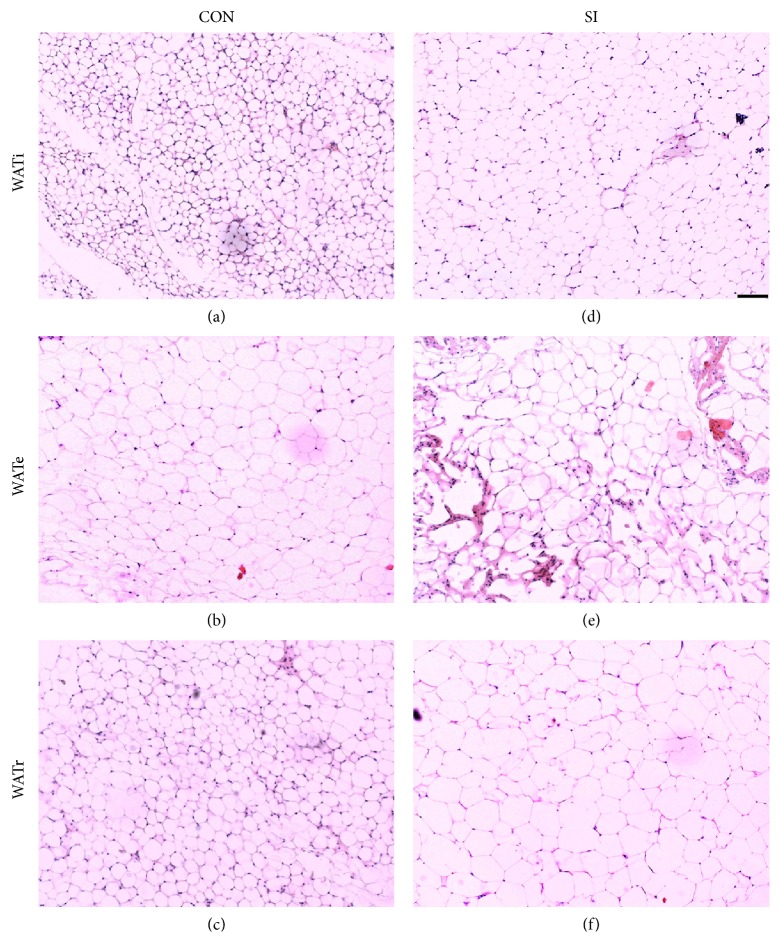
Figure 2.
Representative sections of H&E stained adipose tissue showing WATi and WATr adipocytes were enlarged in SI mice ((d) and (f), resp.) compared to control C57BL/6 mice ((a) and (c), resp.). In contrast, WATe adipocytes were comparable in size between the two groups ((b) and (e)). Scale bar = 100 μm.

