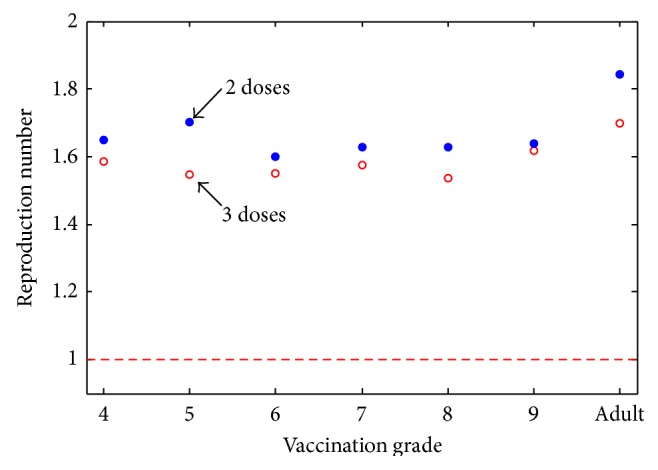
Figure 4.

Effect of mean R 0 values based on the grade of vaccination. For each grade of vaccination, the mean R 0 was calculated from a run of 1000 parameters chosen using Latin Hypercube Sampling. The number of doses is defined by different ranges of ϵ and ϵ W. The dashed red line indicates the threshold R 0 = 1. The dosing program (either two or three doses) that leads to the lowest mean R 0 is not consistent nor does it show a grade-related trend. For a childhood-only program, the mean R 0 is always above 1, independent of the number of doses given. For an adult-only vaccination program, the mean R 0 is significantly higher, suggesting that a childhood-only vaccination program will be more successful than an adult-only one, even if neither leads to eradication.
