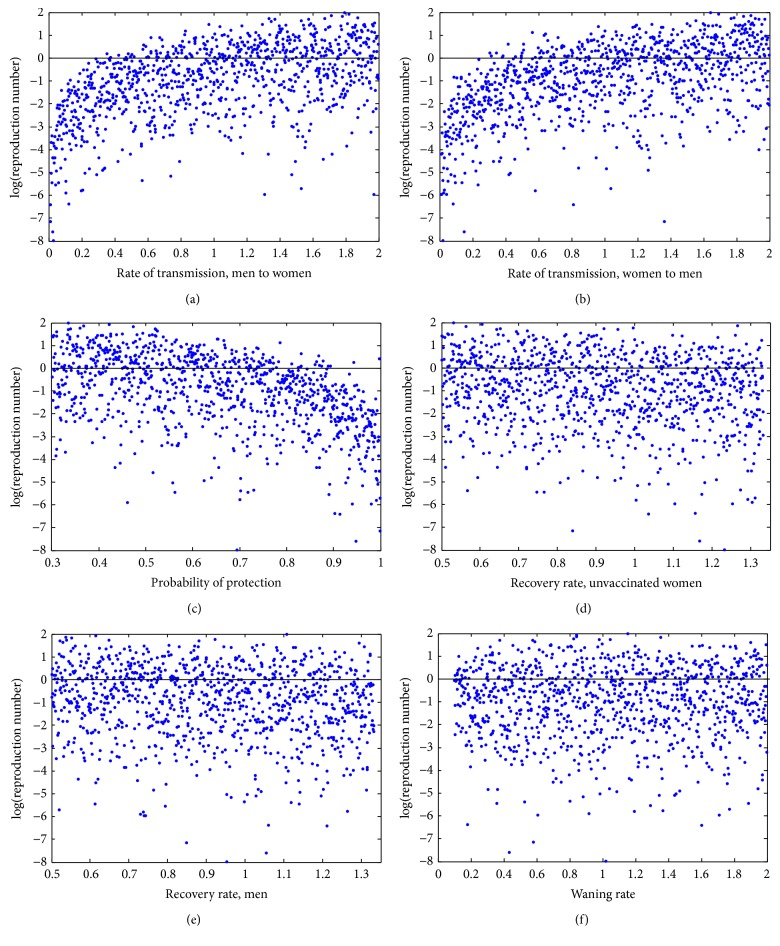
Figure 6.
Latin Hypercube Sampling output for parameters of interest. Each graph shows the sampled parameter values from the given range on the horizontal axis and its degree of correlation between the sampled value and the value of R 0. The increasing trend seen in the top two panels indicates a high degree of correlation between the values of β W or β M and their influence on R 0. The next most influential parameter is the probability of protection (ψ), which has the opposite trend. Other parameters of interest (ξ U, ξ V, ω) are included for completeness but have only a very weak correlation with R 0.

