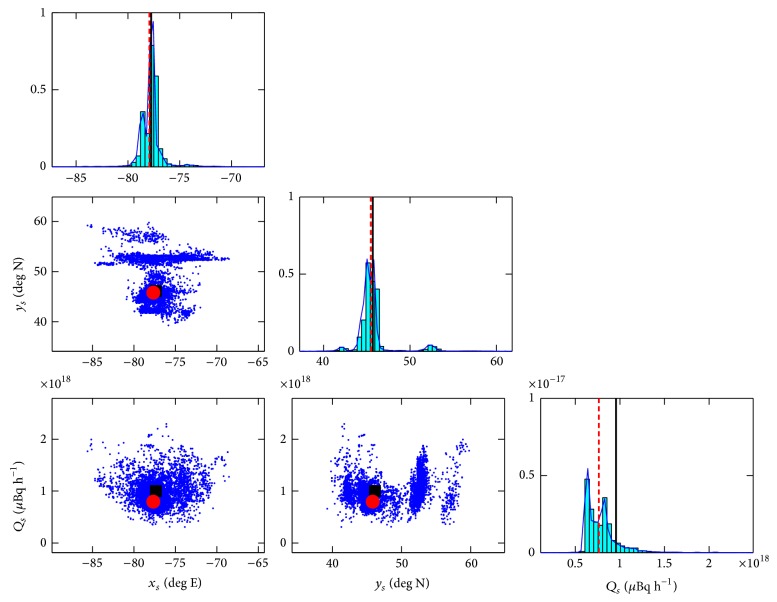
Figure 4.
Univariate (diagonal) and bivariate (off-diagonal) marginal posterior distributions of the source parameters; namely, longitudinal position x s, latitudinal position y s, and emission rate Q s. The true parameter values are shown by a solid square or a solid vertical line and the best estimates of the parameter values are represented as a solid circle or a dashed vertical line. The reconstruction was obtained using the alternative measurement model which employs multipliers to compensate for the unknown model error structure.

