
Figure 2.
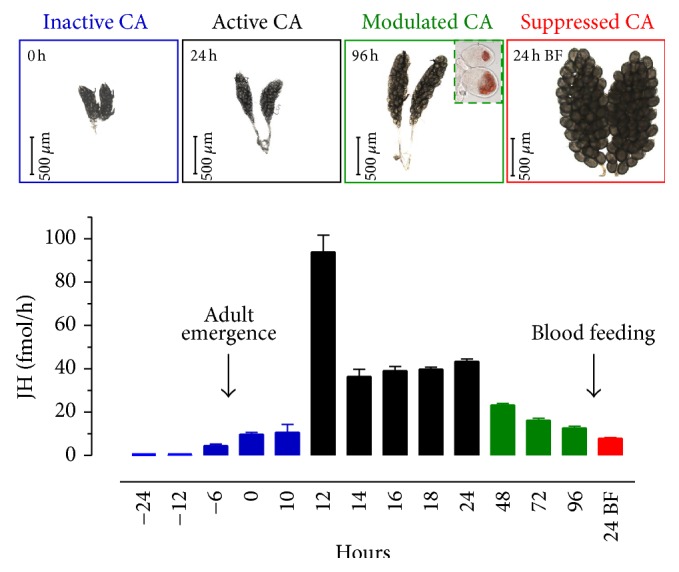
JH biosynthesis rates and ovarian development in female mosquitoes. Top panel: representative images of the progression of ovary development from emergence to 24 h after blood feeding. The inset in 96 h shows the lipid content of follicles from females fed 3% sugar (top) and 20% sugar (bottom). Colors for the panels match the colors for the nutrition-dependent physiological states of the CA shown in the panel below. Bottom panel: JH biosynthesis by CA dissected from pupa, sugar-fed, and blood-fed adult females. Hours represent times before (pupa) and after adult emergence (sugar-fed), or after blood feeding (BF). Y-axis: JH biosynthesis expressed as fmol/h. Bars represent the means ± SEM of three independent replicates of three groups of 3 CA. Colors represent the four distinct CA physiological phases identified: inactive or low activity CA (blue), active CA (black), modulated CA (green), and suppressed CA (red), from [12].