Figure 2.

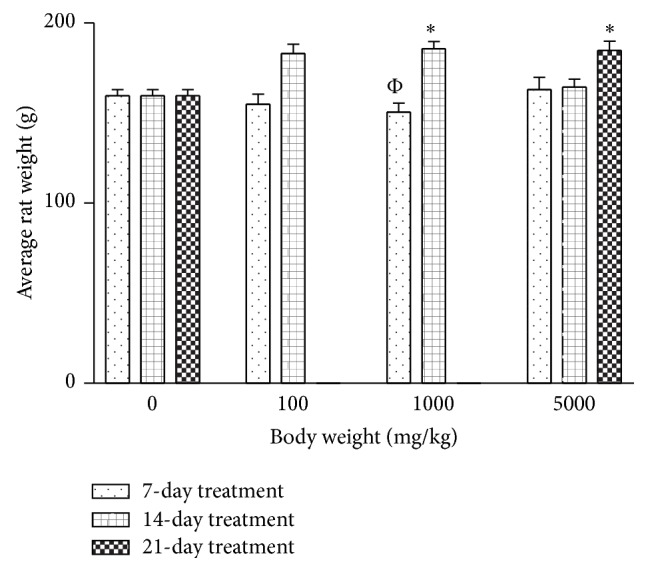
Effects of silver nanoparticles on the weight of the Wistar rats. Values are expressed as mean ± standard error of mean (SEM, n = 5). Values at P < 0.05 are significant. ∗ versus control; Φ versus 1000 mg 14-day treatment.

Effects of silver nanoparticles on the weight of the Wistar rats. Values are expressed as mean ± standard error of mean (SEM, n = 5). Values at P < 0.05 are significant. ∗ versus control; Φ versus 1000 mg 14-day treatment.