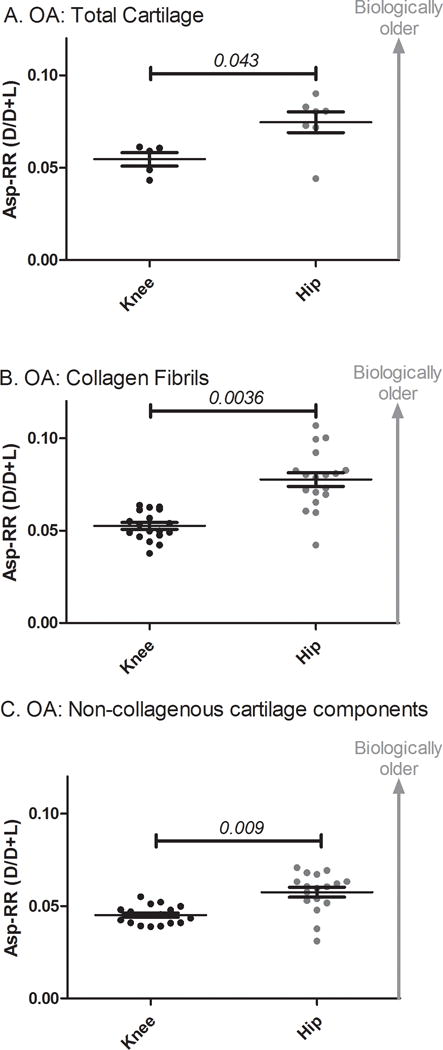
Figure 2. Scatter dot plot for Asp racemization ratio (Asp-RR) by joint site.

Knee OA total cartilage (A), collagen fibrils (B) and non-collagenous cartilage components (C) had significantly lower Asp-RRs than hip OA. There were significant differences between the age groups for cartilage from the different joint sites so age adjusted p-values were calculated using age, gender and joint site as covariates in a multivariable linear regression.
