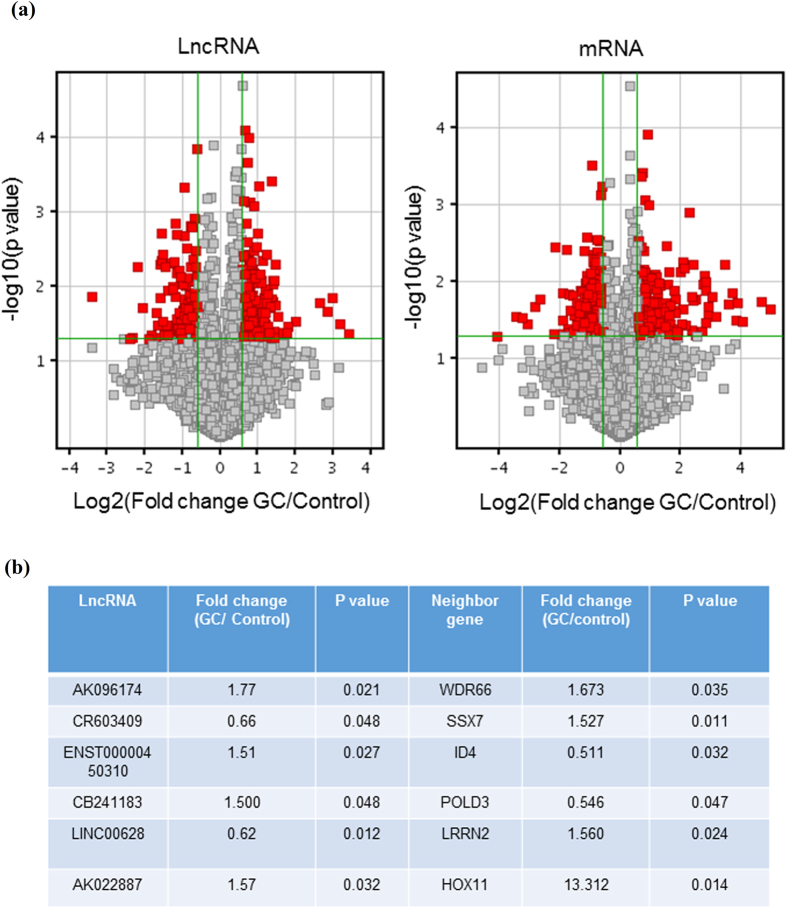
Figure 1. Six lncRNAs and their neighboring genes have disturbed expressions in GC samples and adjacent normal gastric mucosa.
Five paired GC tumor tissues and adjacent non-tumor samples were collected. Total RNA was extracted and the expression of 33045 LncRNAs and 30215 mRNAs were determined by microarray. Analysis combining the data of lncRNAs and mRNAs, 6 lncRNAs have significantly altered expression, and in the same time, their neighboring genes (located near 300 kb upstream or downstream of lncRNA locus) level changed significantly. The vertical lines correspond to 1.5-fold up and down and the horizontal line represents a P-value of 0.05. The red point in the plot represents the differentially expressed LncRNAs with statistical significance.

