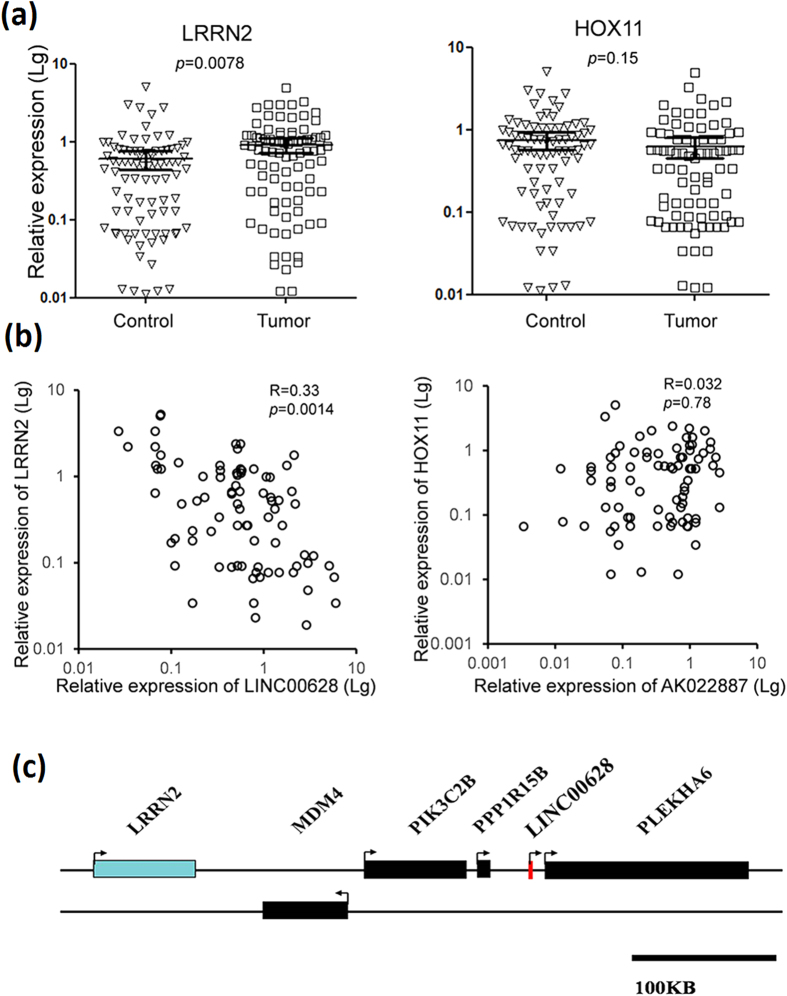
Figure 3. The expression of LRRN2 is negatively correlated with LINC00628 level in GC samples.
(a) The mRNA levels of LRRN2 and HOX11 were determined by qRT-PCR. The results were analyzed by student’s t-test and p < 0.05 was considered statistically significant. (b) χ2-analysises were used to determine the correlation between lncRNAs and their neighboring genes. (c) Schematic diagram for exhibiting the relative position between LINC00628 and LRRN2.

