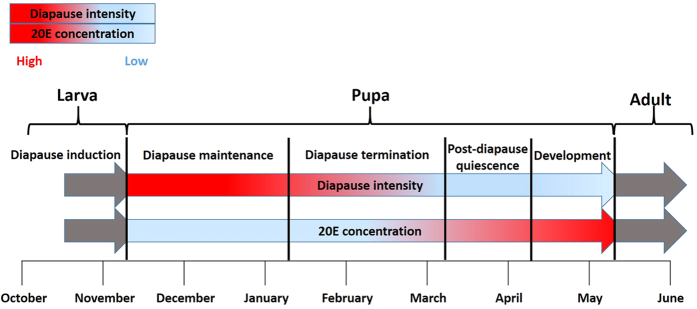
Figure 6. Schematic illustration of Bactrocera minax pupal diapause intensity and 20E concentration during different pupal ontogenetic processes.
The first line indicates diapause intensity and second line shows 20E concentration. The red colour means the high diapause intensity and the high concentration of 20E, whereas the light blue colour is on the contrary.

