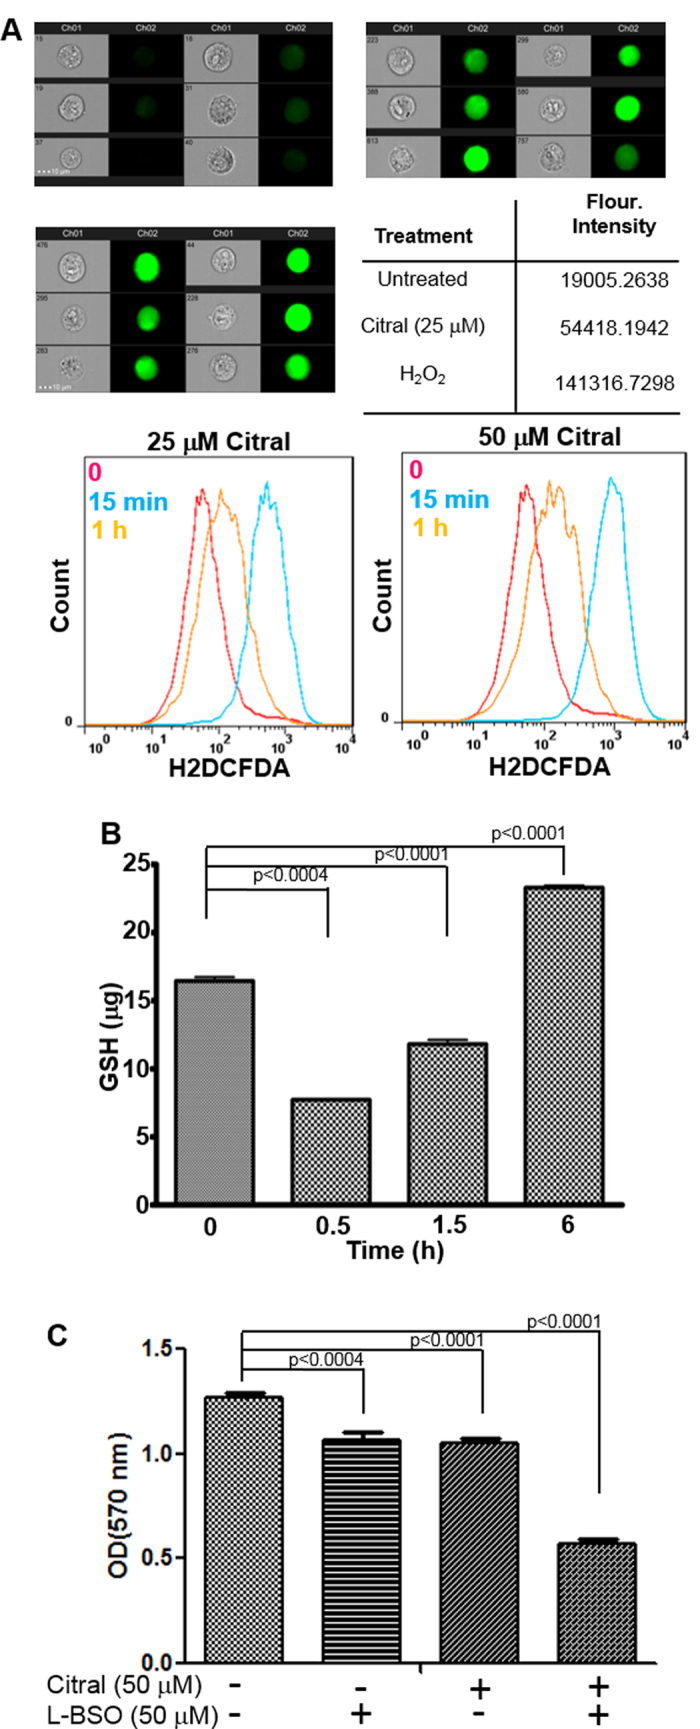
Figure 6. Citral-induces oxidative stress.

A, To monitor changes in intracellular oxygen radicals, ECC-1 cells were labeled with the oxygen radical sensor, H2DCFDA, prior to treatment with citral. Increase in oxygen radicals was monitored by imaging cytometry (upper and middle panels) and flow cytometry (lower panel). Imaging cytometry data is shown for six representative cells out of 10,000 total events analyzed. Data shown is representative of two separate experiments. Bright field and fluorescent images for each treatment are shown. Results from cells treated with media (upper left), 25 μM citral (upper right) and hydrogen peroxide (middle left) are shown. The table (middle right) shows mean fluorescence intensity of the 10,000 total evens for each condition tested. To determine changes in intracellular oxygen radical levels over time, H2DCFDA-labeled ECC-1 cells were monitored by flow cytometry after treatment for 0, 15 min and 1 h with 25 and 50 μM citral (bottom left and right panels). Each histogram is representative of three independent experiments. B, ECC-1 cells were treated with citral (50 μM). At the designated time points, the cells were lysed to measure levels of GSH. Data shown is representative of two independent experiments, each conducted in duplicate. C, ECC-1 cells were treated with citral and L-BSO as shown. Proliferation of the cells was determined at 72 h using MTT assay.
