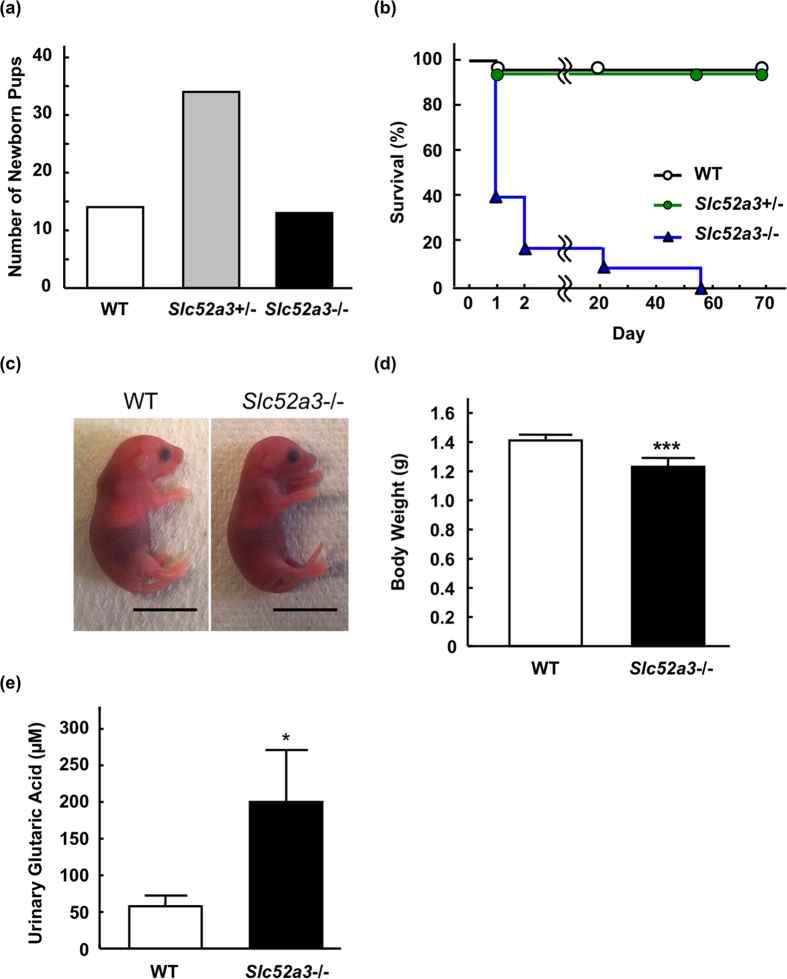
Figure 1. Phenotypic analyses of Slc52a3−/− mice.
(a) Genotypic distribution immediately after birth (n = 63 from 8 litters). (b) Kaplan-Meier survival curves for WT (n = 14; open circles, black line), Slc52a3+/− (n = 34; closed circles, green line) and Slc52a3−/− (n = 13; closed triangles, blue line) littermates. (c) Gross appearance of whole body of WT, Slc52a3+/− and Slc52a3−/− newborn pups at postnatal day 0 (P0). (d) Body weight of WT, Slc52a3+/− and Slc52a3−/− littermates at P0. (e) Urinary glutaric acid levels in WT and Slc52a3−/− littermates at P0. Each scale bar represents 1 cm length. Each column or point represents the mean ± SD. Values where *P < 0.05, or ***P < 0.001, significantly different from WT.

