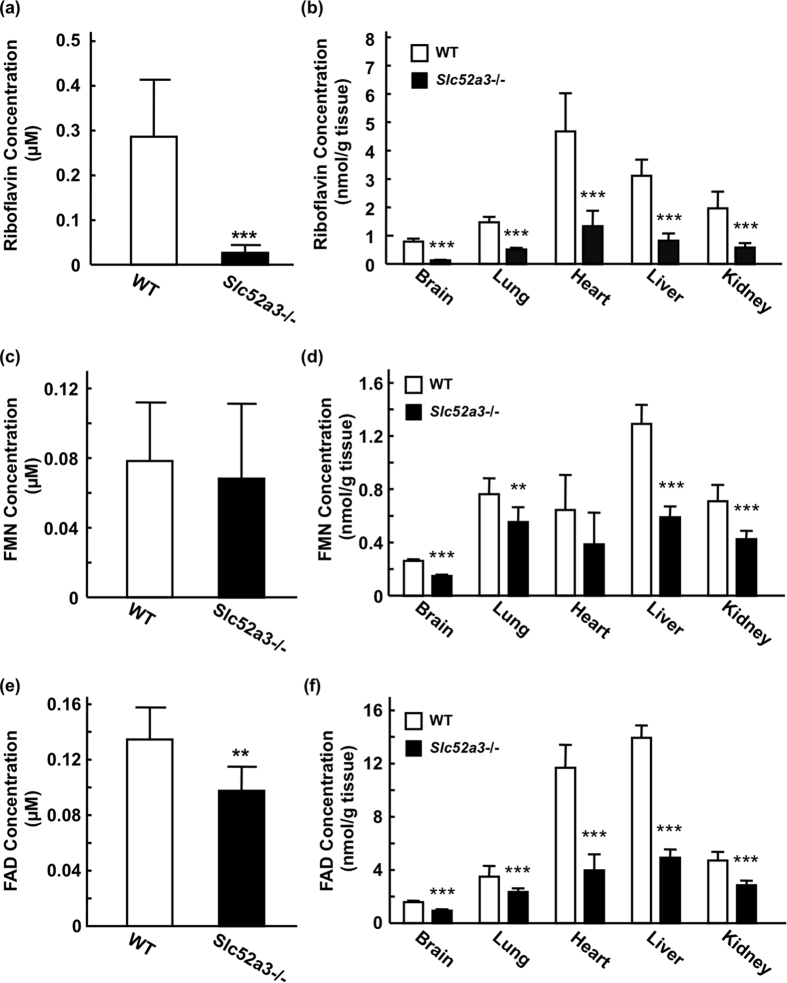
Figure 2. Riboflavin, FMN, and FAD levels in plasma and tissues from WT and Slc52a3−/− mice.
Plasma and tissues were obtained from WT (n = 14) and Slc52a3−/− (n = 13) littermates at postnatal day 0 (P0) immediately after birth. Plasma concentrations of riboflavin (a), FMN (c) and FAD (e) were measured by HPLC. Tissue levels of riboflavin (b), FMN (d) and FAD (f) were also determined. Each column represents the mean ± SD. Values where **P < 0.01, ***P < 0.001, significantly different from WT.

