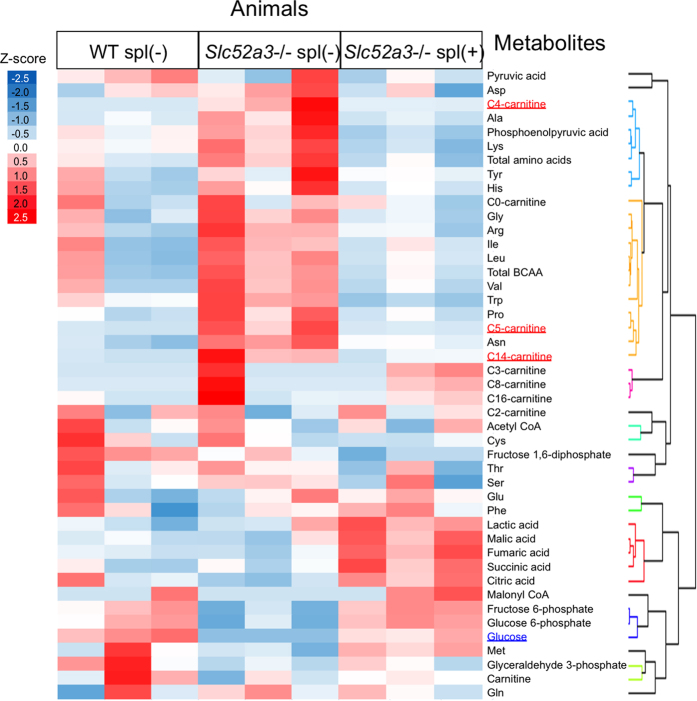
Figure 6. Metabolome analysis in Slc52a3−/− neonatal mice.
Hierarchical clustering of targeted metabolomics data. Amino acids, metabolites of glycolysis and TCA cycle in liver, plasma acylcarnitine, and blood glucose in WT, Slc52a3−/− pups (Slc52a3−/− spl(−)) and riboflavin-supplemented Slc52a2−/− pups (Slc52a3−/− spl(+)) are listed on the abscissa. The color in the heat map reflects the relative metabolite abundance level according to the z-score.

