
Figure 2. OHT induces up-regulation of A2AR without altering the expression of A1R.
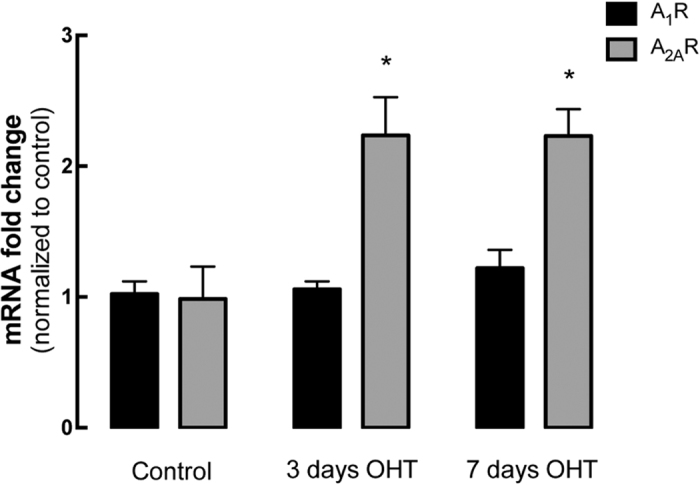
The expression of A1R and A2AR mRNA was assessed by qPCR in the retinas of control animals and animals with 3 or 7 days of OHT. Results are presented as fold change comparing with the control animals, and represent the mean ± s.e.m of 5 to 7 independent experiments. #p < 0.05, significantly different from control animals; Kruskall-Wallis test, followed by Dunn’s multiple comparison test.