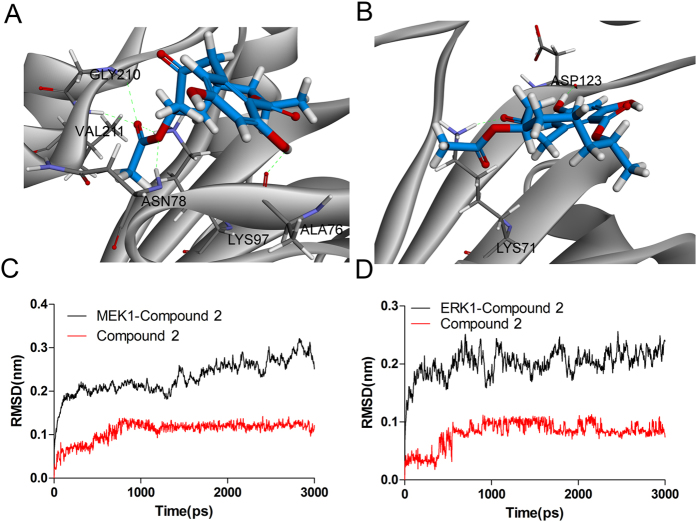
Figure 6. Binding analysis of compound 2 with the ATP binding domain of MEK1 and ERK1 proteins.
(A) The binding model of compound 2 (colored red) with MEK1. Compound 2 and its hydrophobic surface in receptor residues were illustrated, from blue for hydrophilic to brown for hydrophobic, the important residues and their critical interactions (dash lines) with compound 2 in the binding site were depicted, conventional hydrogen bond, hydrophobic interactions were colored green and carnation, respectively. (B) The Binding model of compound 2 (colored marine) with ERK1. (C) RMSD of MEK1-compound 2 complex and compound 2 during the 3ns MD simulation. (D) RMSD of ERK1-compound 2 complex and compound 2 during the 3ns MD simulation.

