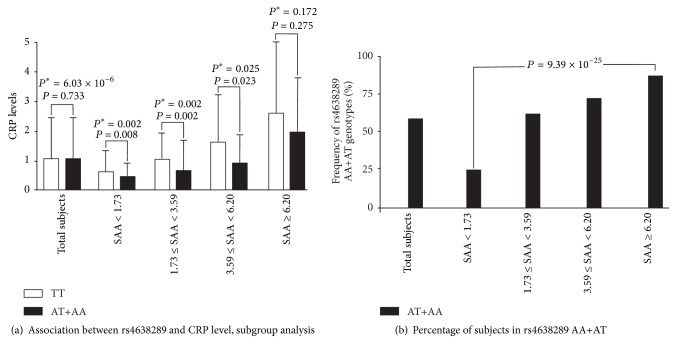
Figure 1.
(a) Subgroup analysis with SAA quartiles on the association between rs4638289 genotypes and CRP levels. (b) Frequencies of subjects with AA+AT genotypes of rs4638289 in each SAA quartile. P value: adjusted for age, sex, body mass index, smoking, and medications for hypertension, diabetes mellitus, and dyslipidemia. P ∗ value: further adjusted for SAA levels.

