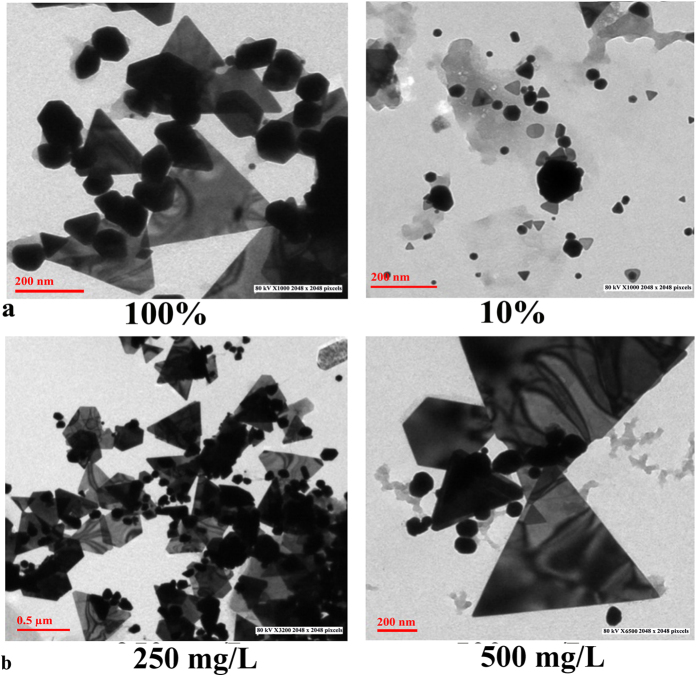
Figure 2.
TEM micrographs of (a) G100.250.7.72.30 and G10.250.7.72.30 showing effect of different concentrations of cell free extracts (100 and 10%) (b) G10.250.7.72.40 and G10.500.7.72.40 showing effect of different concentrations of HAuCl4 (250 and 500 mg/L) on shapes and sizes of gold nanoparticles.

