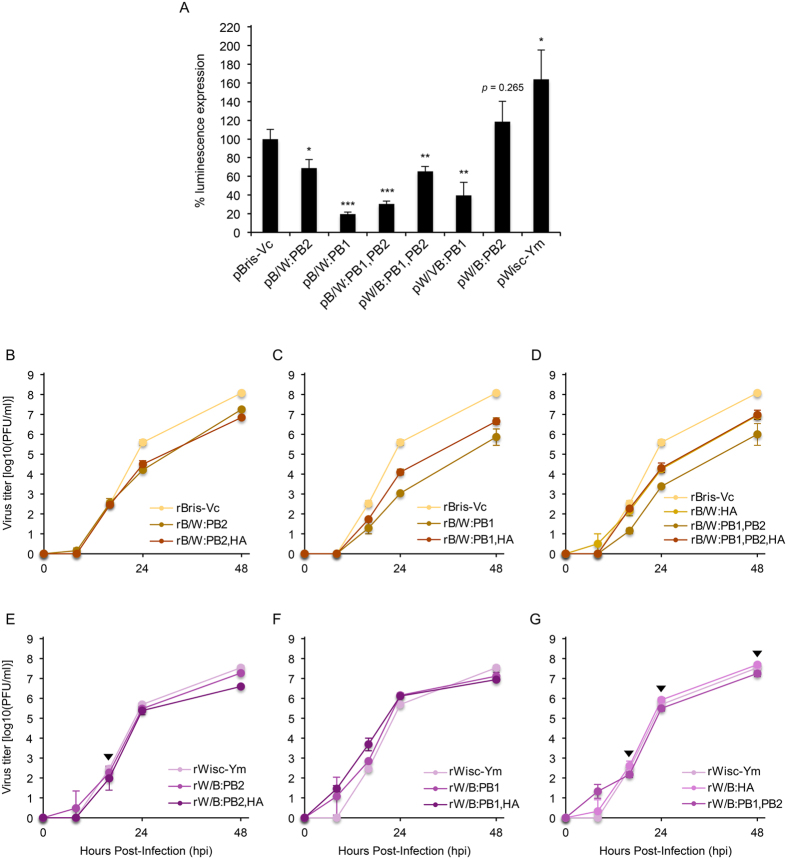
Figure 2. Polymerase activity and replication property of PB1, PB2, and/or HA reassortants of IBVs.
(A) Relative activity of combinations between B/Brisbane/60/2008 (B, Victoria lineage) and B/Wisconsin/01/2010 (W, Yamagata lineage) RNP complex genes (PB1, PB2, PA, and NP) was determined in 293T cells based on the luminescence expression of the Bris-Vc RNP complex. The name in the x-axis represents a combination of RNP plasmids (abbreviated as ‘p’) (e.g., pB/W:PB1 represents a combination of Bris-Vc RNP plasmids harboring the Wisc-Ym PB1 instead of the Bris-Vc PB1). (B–G) Replication kinetics of PB1-, PB2-, and/or HA-reassorted viruses on the genetic backbone of Bris-Vc or Wisc-Ym virus was determined in MDCK cells. The results were represented from the mean values of three independent experiments. The name of a virus (abbreviated as ‘r’) in the x-axis is represented with the same annotation of the RNP complex combinations explained above. Statistical significance of the results (for polymerase activity, against the wild-type Bris-Vc RNP complex and for replication kinetics, against either rBris-Vc or rWisc-Ym virus) was assessed using a Student’s t test (*p < 0.05; **p < 0.01; and ***p < 0.001). For the growth kinetics analysis, most results exhibited statistical significance (at least, p < 0.05) except for the viruses indicated with an arrowhead (p values of rW/B:PB2, 0.32 at 16 hpi; rW/B:PB2,HA, 0.26 at 16 hpi; rW/B:HA, 0.26 and 0.14 at 16 and 48 hpi, respectively; and rW/B:PB1,PB2, 0.09 and 0.08 at 24 and 48 hpi, respectively). Error bars denote standard deviation.

