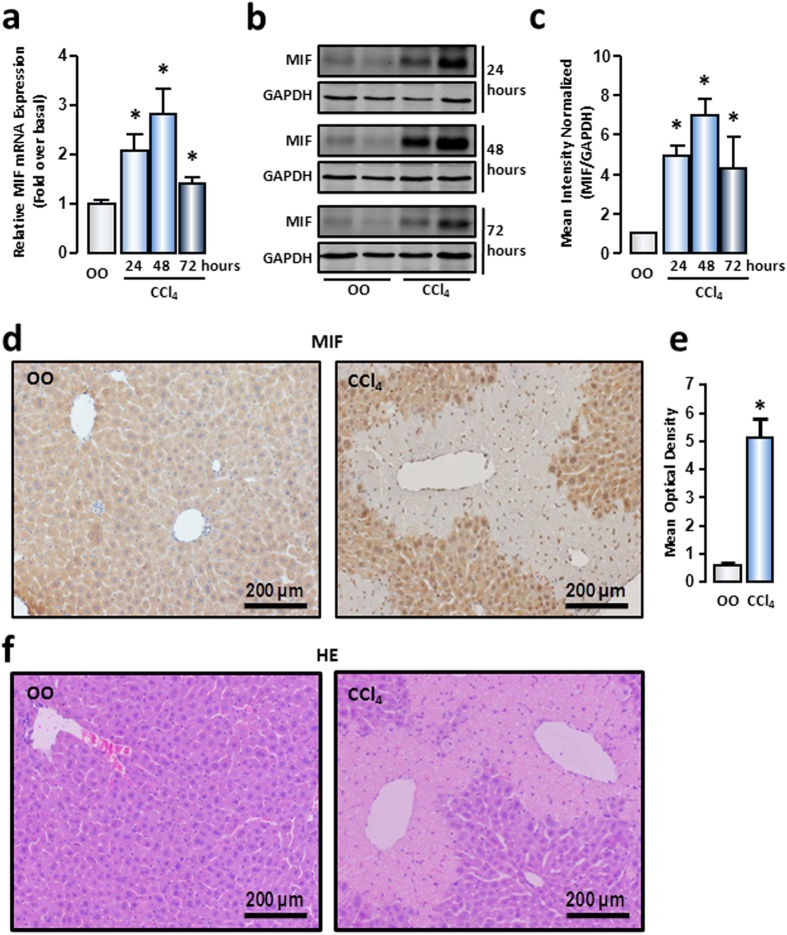
Figure 1. MIF expression and distribution in acute injured liver induced by CCl4.
After CCl4 administration at 24 hours, 48 hours and 72 hours, mRNA (a) and protein (b) expression of MIF in mice livers were measured by real-time RT-PCR and Western blot, respectively. (c) The quantitative assay of Western blot was executed by Odyssey® software. The representative images of immunohistochemical staining (d) and HE staining (f) were shown to track MIF (brown) in liver tissue of normal or CCl4–treated mice. (e) The mean optical density in immunohistochemical staining images of MIF was measured by Image-Pro Plus software. Scale bars: 200 μm. Data are presented as the means ± SEM. *P < 0.05 vs control group (n = 6, per group).

