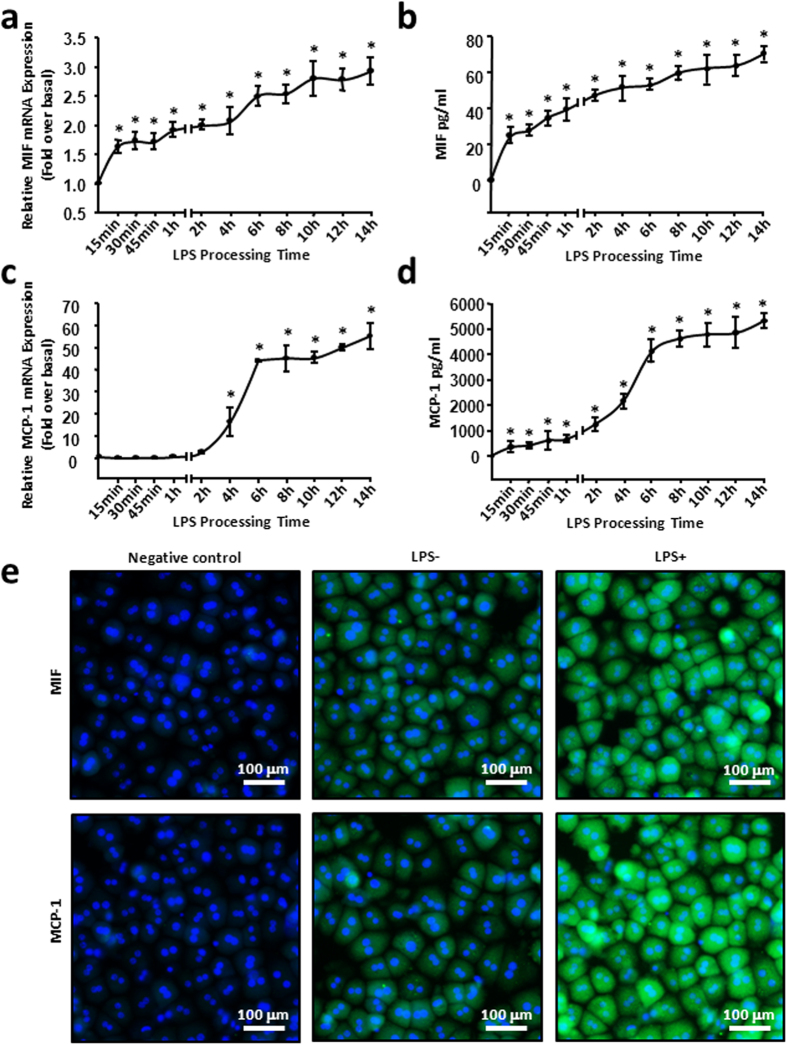
Figure 2. LPS induced increase of MIF appeared earlier than MCP-1 in hepatocytes.
Mouse primary haptocytes were treated with 100 ng/mL LPS and collected at the described time points, the relative mRNA (a,c) expression and protein secretion (b,d) of MIF and MCP-1 were examined by real-time RT-PCR and ELISA. (e) The representative images of immunofluorescence for MIF or MCP-1 (green) in mouse primary hepatocytes, as visualized by immunocytochemical analysis. Cells were co-stained with DAPI to identify nuclei (blue). Scale bars, 100 μm. All results were confirmed in three independent experiments at least. *P < 0.05 vs untreated control cells.

