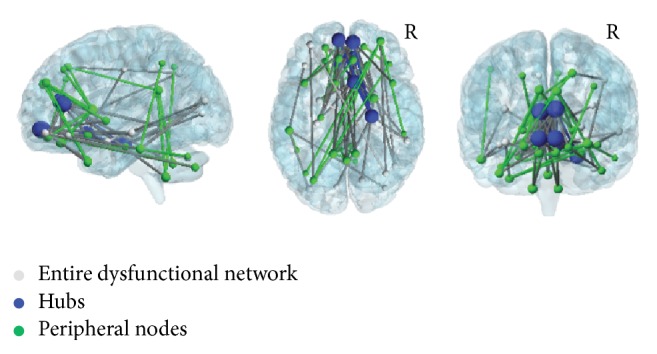
Figure 1.

Reduced connectivity of DM1 brains obtained by network-based analysis. Widespread pattern of functional brain disconnection in patients with DM1 compared to healthy subjects (grey, blue, and green nodes). When Bonferroni's correction was applied to identify the most critical nodes of this dysfunctional network, two populations were identified, the “hubs” (blue) and the peripheral nodes (green). “Hubs,” characterized by the largest number of connections, were located in the anterior cingulum and in the orbitofrontal cortex bilaterally and in the right parahippocampal gyrus. Peripheral nodes (green), characterized by a smaller number of connections, were mainly located in the prefrontal, temporal, and parietal cortices and in the cerebellum. In the picture, node's size is proportional to the number of its connections. The brain network was visualized using the BrainNet Viewer (https://www.nitrc.org/projects/bnv/) [21]. See text for further details. R = Right.
