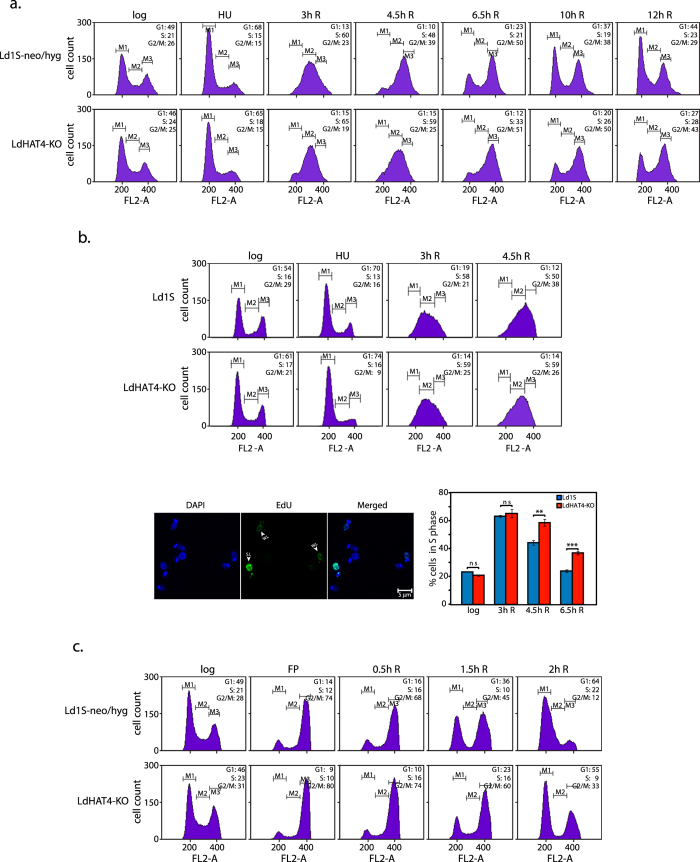
Figure 3. Comparison of flow cytometry profiles of LdHAT4-KO cells with those of Ld1S-neo/hyg cells.
(a) Promastigotes synchronized at G1/S transition using 5 mM hydroxyurea and then released into S phase. (b) Promastigotes synchronized using hydroxyurea and then released into S phase. Aliquots of cells were pulsed with EdU for 15 min at 3 h, 4.5 h and 6.5 h after release. Upper panels: flow cytometry analysis at different time intervals. Bottom left panels: representative field showing EdU-labeled and unlabeled cells. Bottom right panel: bar chart representing percent cells in S phase at each time-point (corresponds to percent EdU-labeled cells). Pulsing of cells with EdU at each time-point was set up in triplicate. Approximately 80–120 cells were analyzed from each technical replicate, and values presented in the bar chart are mean values, with error bars indicating standard deviation. Student’s t-test (two-tailed) was applied to analyze the data. P values obtained: ns=non-significant, **p < 0.005, ***p < 0.0005. (c) Promastigotes synchronized at G2/M using 5 μM flavopiridol and then released into G1 phase. In all flow cytometry panels the time indicated above each histogram indicates the time after release from block (eg 3h R indicates 3 hours after release). The synchronization regime experiments in (a) and () were each performed three times as detailed in Methods, and one dataset for each regime is shown here. For each cell type 30,000 events were recorded at every time-point, and data were analyzed using CellQuest Pro Software (BD Biosciences). M1, M2 and M3 gates indicate G1, S and G2/M phases respectively. Numbers at upper right in each panel represent percent cells at each cell cycle stage. Combined statistical analyses of all data sets are presented in Supplementary Tables 1 and 2.

