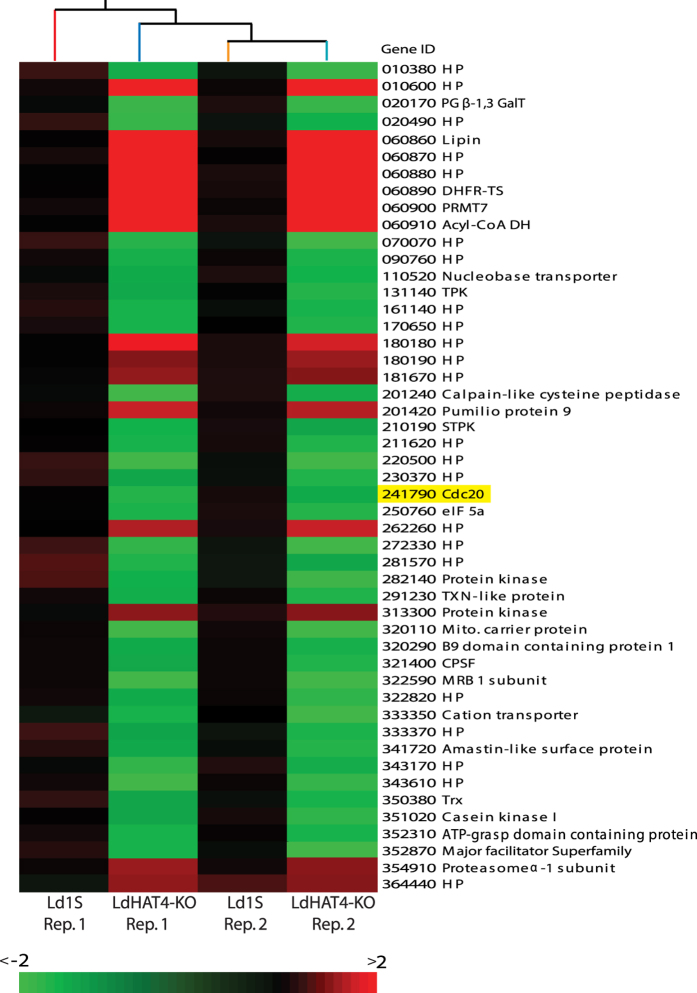
Figure 6. DNA microarray analysis of HAT4-nulls in comparison with wild type cells.
Microarray analysis was carried out using the Agilent–based platform GPL18125, as described in Methods. Biological replicates of each cell type were analyzed, and comparative analyses of gene expression in LdHAT4-KO cells with reference to wild type cells was carried out using GeneSpring GX Version 12.1. The heat map presented here shows genes that were differentially expressed in LdHAT4-KO cells as compared to control Ld1S, with green signifying downregulated genes and red signifying upregulated genes. Rep.1: replicate 1, Rep.2: replicate 2. Complete data available at Gene Expression Omnibus, Accession GSE76574.

