Figure 7.
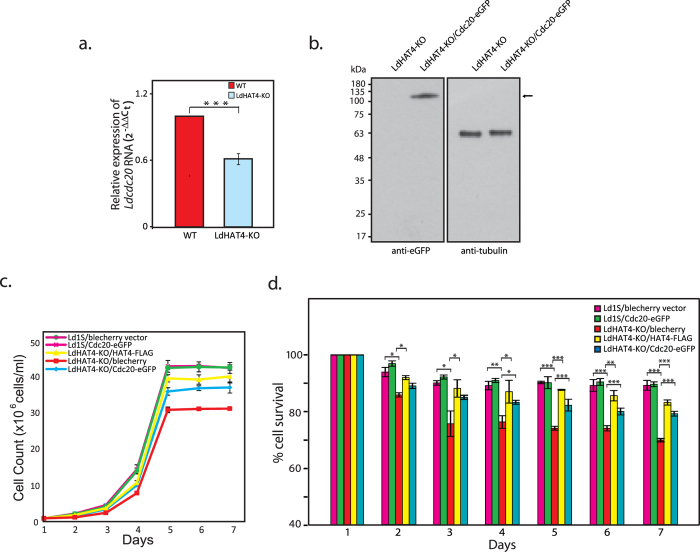
(a) Real Time PCR analysis. Expression of Ldcdc20 in LdHAT4-KO cells was compared to its expression in wild type cells. Differential expression was estimated using the 2−ΔΔCT method, as detailed in Methods. Student’s t-test (two-tailed) was applied to analyze the data. P value obtained: 0.0002. (b) Analysis of ectopic expression of LdCdc20-eGFP in LdHAT4-KO cells. Whole cell extracts from LdHAT4-KO cells and LdHAT4-KO/Cdc20-eGFP cells were analyzed by western blots using anti-eGFP antibodies (1:1000 dilution; 3.2 × 10⁸ cell equivalents loaded per cell type) and anti-tubulin antibodies (1:5000 dilution; 5 × 10⁷ cell equivalents loaded per cell type). (c) Growth analysis. Growth pattern of LdHAT4-KO/Cdc20-eGFP cells was compared with that of knockout line harbouring empty vector (LdHAT4-KO/blecherry), as well as with Ld1S either harbouring empty vector (Ld1S/blecherry) or expressing Cdc20-eGFP episomally (Ld1S/Cdc20-eGFP). (d) Analysis of cell survival. Percent LdHAT4-KO/Cdc20-eGFP survivors was compared with percent survivors in knockout line LdHAT4-KO/blecherry, as well as Ld1S/blecherry and Ld1S/Cdc20-eGFP lines, every 24 hrs over a period of seven days. For growth and survival analyses three biological replicates were initiated and carried out in parallel, and mean values are presented, with error bars indicating standard deviation. Student’s t-test (two-tailed) was applied to analyze the data. P values obtained: *p < 0.05, **p < 0.005, ***p < 0.0005.

