Figure 8.
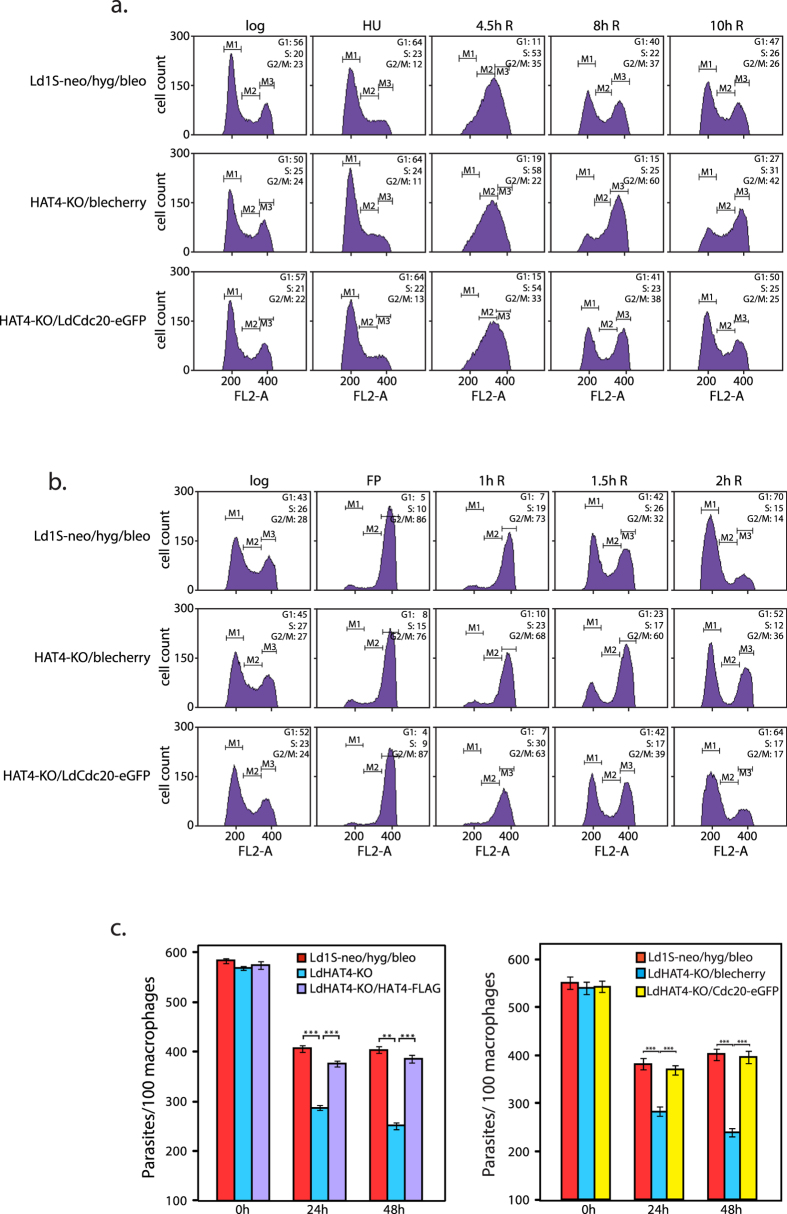
(a,b) Flow cytometry profiles comparing LdHAT4-KO cells expressing Cdc20-eGFP ectopically and LdHAT4-KO cells. For each cell type 30,000 events were recorded at every time-point, and data were analyzed using CellQuest Pro Software (BD Biosciences). M1, M2 and M3 gates indicate G1, S and G2/M phases. Time indicated above each histogram indicates the time after release from block. Percent of cells in G1, S and G2/M at the different time-points are indicated in the upper right-hand corner of each histogram box. (a) Promastigotes were synchronized at G1/S using 5 mM hydroxyurea and released into S phase. (b) Promastigotes were synchronized at G2/M using 5 μM flavopiridol and released into G1 phase. Both experiments were performed three times, with one dataset of each being presented here. Combined statistical analyses of all data sets are presented in Supplementary Tables 5 and 6. (c) Left panel: Effect of ectopic expression of HAT4-FLAG in LdHAT4-KO on parasite survival within macrophages. Right panel: Effect of ectopic expression of Cdc20-eGFP in LdHAT4-KO on parasite survival within macrophages. Three replicates of each experiment were separately initiated and carried out in parallel. The number of parasites within macrophages were scored microscopically using DAPI staining and Z-stack image analysis with the help of a confocal microscope Mean values are presented in the bar charts. Error bars indicate standard deviation. Student’s t-test (two-tailed) was applied to analyze the data. P values obtained: ***p < 0.0005, **p < 0.005.

