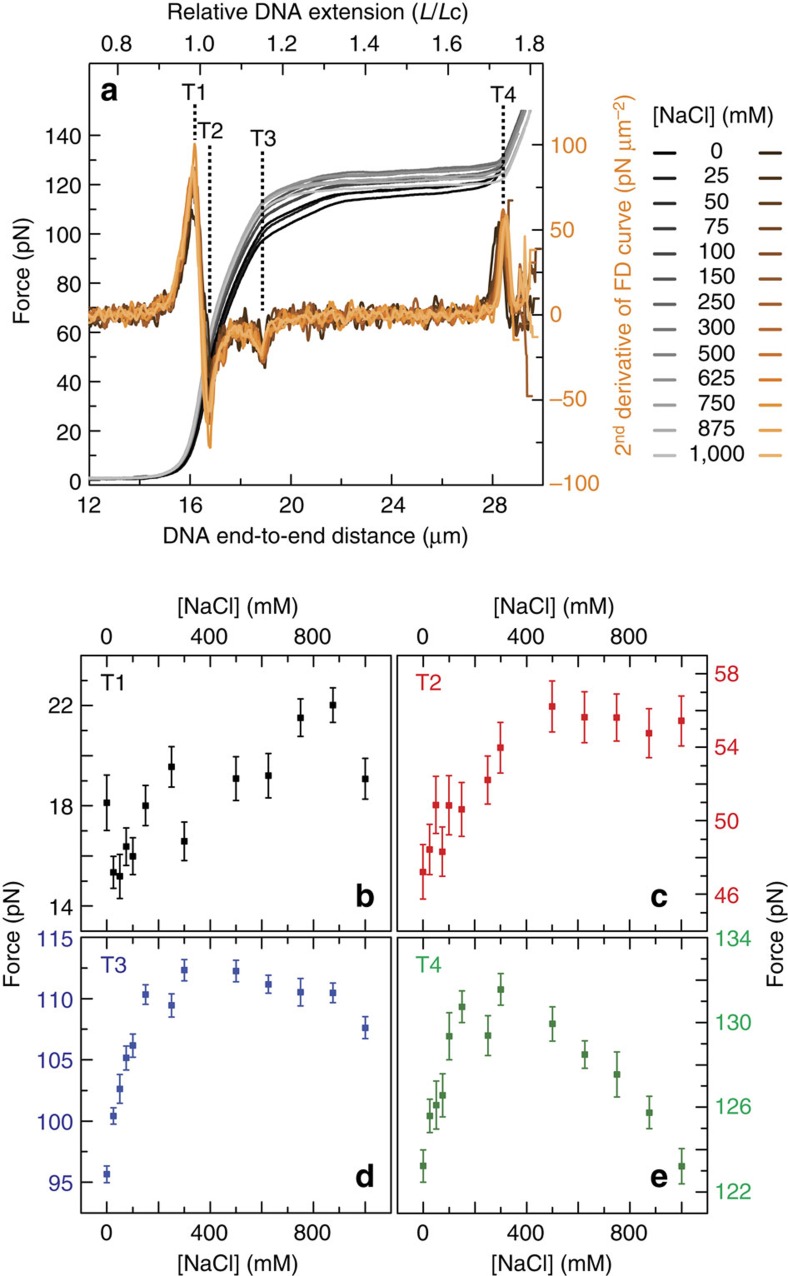
Figure 2. FD curves and their second derivatives of torsionally constrained DNA under varying ionic strength.
(a) Average FD curves (grey-scale), together with the second derivative of each curve (orange-scale) as the concentration of NaCl is increased. Dashed lines highlight the peaks in the second derivative profiles associated with T1–T4, as defined in Fig. 1. (b–e) Force associated with torsionally constrained DNA at T1–T4, respectively, as a function of NaCl concentration. Errors are standard errors of the mean (s.e.m.; N∼10).

