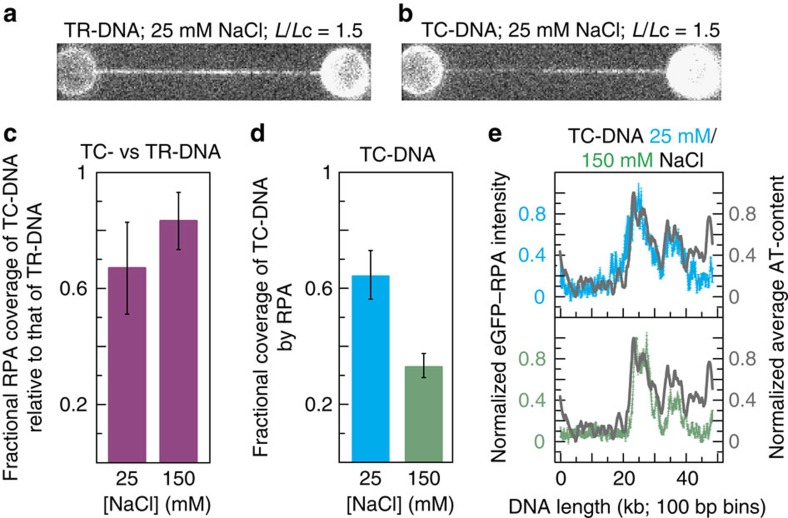
Figure 4. DNA coverage by RPA decreases when under torsional constraint and at elevated ionic strengths.
(a,b) Sample fluorescence images of eGFP–RPA bound to torsionally relaxed (TR-)DNA and torsionally constrained (TC-)DNA, respectively. Data obtained at L/Lc=1.5 and in 25 mM NaCl. (c) Fractional eGFP–RPA coverage of torsionally constrained (TC-)DNA relative to that of torsionally relaxed (TR-)DNA, shown for both 25 mM NaCl and 150 mM NaCl. For each salt condition, three comparisons were made (N=3), consisting of DNA molecules at an identical L/Lc (1.2≤L/Lc≥1.6). (d) Fractional coverage of torsionally constrained (TC-)DNA by eGFP–RPA at L/Lc=1.2 in 25 mM NaCl (blue) and 150 mM NaCl (green). N=3 in each case. (e) eGFP–RPA fluorescence intensity along the length of the torsionally constrained (TC-)DNA molecule (averaged over N=6, with error bars shown) in 25 mM NaCl (blue) and 150 mM NaCl (green). Fluorescence intensity profiles are oriented in the direction that best matches the average AT-content of the DNA molecule (grey). Errors are s.e.m.

