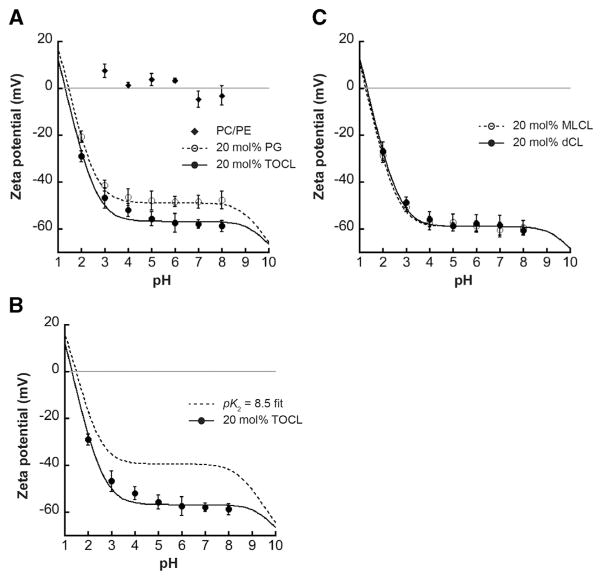
Fig. 3.
pH-dependent ζ potential profiles. Measurements of ζ potential for LUVs of defined lipid composition in a phosphate/citrate buffer system are shown for each value of bulk pH (symbols are mean values of a minimum of three independent samples; error bars are SD). Lines indicate fits to the data based on Gouy–Chapman–Stern analysis. pKa values reported below are based on acid dissociation constants of phosphate groups from data fits; for CL-containing samples, it is assumed that pK1 = 1.0. A) Composite ζ potential profile for vesicles containing POPC/POPE host lipids only (diamonds), 20 mol% POPG (open circles, dashed line; pKa = 0.99) or 20 mol% TOCL (closed circles, solid line; pK2 = 1.59). B) Measured ζ potential profile for TOCL-containing vesicles (closed circles, dashed line, pK1 = 1.0 and pK2 = 1.59) shown with the calculated profile of the same lipid system wherein TOCL phosphates have disparate ionization constants (dashed line, pK1 = 1.0 and pK2 = 8.5). C) Measured ζ potential profiles for vesicles containing 20 mol% MLCL (open circles, dashed line; pK2 = 1.36) and 20 mol% dCL (closed circles, solid line; pK2 = 1.64).

