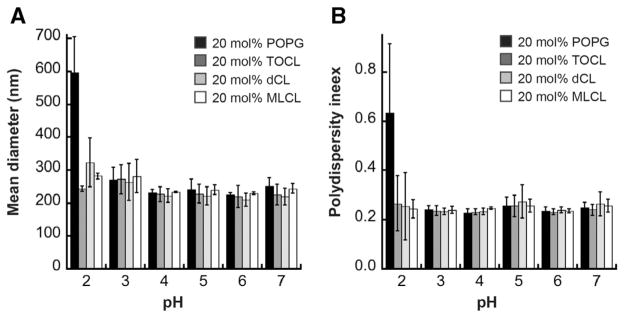
Fig. 4.
pH-dependent liposome size distribution. A) Average diameters (reported as Z-average values) and B) polydispersity indeces of liposomes prepared in a POPE/POPE background with 20 mol% POPG (black) TOCL (dark gray), dCL (light gray) or MLCL (white) at the indicated pH values, as measured by dynamic light scattering. Each value represents an average of three independent measurements; error bars are standard deviations.

