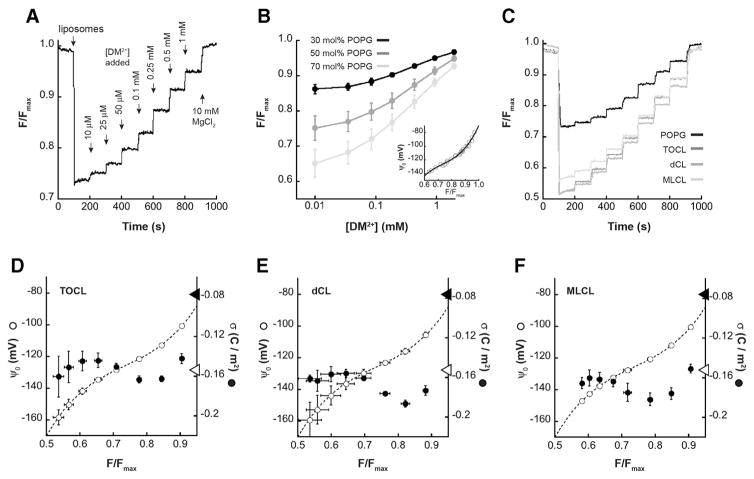
Fig. 5.
9-AA analysis of surface charge density. LUVs with different concentrations of anionic phospholipid were subjected to time course titrations with DM2+ in the presence of the fluorescent probe 9-AA. Steady-state measurements of 9-AA fluorescence were normalized to the maximal value following MgCl2 addition and quantified as F/Fmax. A) Representative time course of 9-AA fluorescence with LUVs containing 50 mol% POPG, showing addition of liposomes, titration of DM2+, and final addition of MgCl2. B) Measured values of F/Fmax (means with SD, n = 3 independent measurements) as a function of [DM2+] for LUVs with varying concentrations of POPG as indicated. Inset, calibration curve relating ψ0 and F/Fmax based on 9-AA data with POPG-containing LUVs. The ψ0 values were calculated based on the relevant σmax values (−0.0687, −0.1144, and −0.1602 C m−2 for LUVs with 30, 50 and 70 mol% POPG, respectively). C) Time courses of 9-AA fluorescence with LUVs containing 50 mol% CL variants (TOCL, dCL or MLCL in dark, medium and light gray as indicated) in comparison with LUVs containing 50 mol% POPG (black). D–F) Profiles of ψ0 and σ for LUVs containing the indicated CL variants based on 9-AA steady-state readings (means with SD, n = 3 independent measurements). Dashed lines show the fit to the ψ0 vs. F/Fmax calibration curve (panel B, inset). Open circles show the calculated ψ0 based on the eight different equivalence point measurements (see Supplementary Fig. S5). Closed circles show calculated σ based on 9-AA values (276.2 M−1, 251.5 M−1, and 203.9 M−1 for TOCL, dCL and MLCL, respectively). Arrowheads on the surface potential axis represent σ values corresponding to one electronic charge per CL headgroup (closed arrowhead) and two electronic charges per CL headgroup (open arrowhead).

