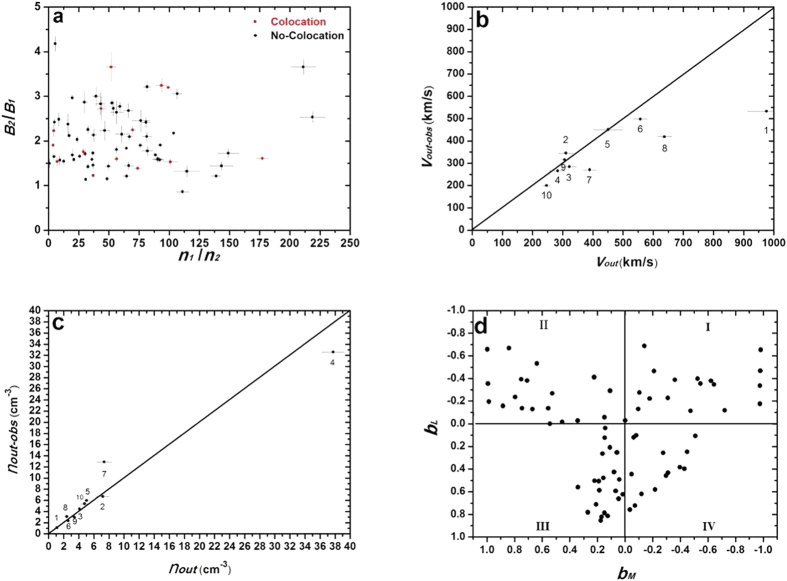
Figure 3. Statistical results for the asymmetric reconnection.
(a) Asymmetric condition for the cases with non-collocation of the BRP and the PJP (black dots) and for the cases with collocation (red dots); (b,c) comparisons of the observed Vout−obs vs. the predicted Vout and the observed nout−obs vs. the predicted nout, respectively; and (d) distribution of Hall fields in the exhaust region. The error bars in Fig. 3a–c indicate the standard deviation of the related parameters from the average of 5 separate data points, based on the definition of the background conditions in the magnetosphere and magnetosheath in section 2.

