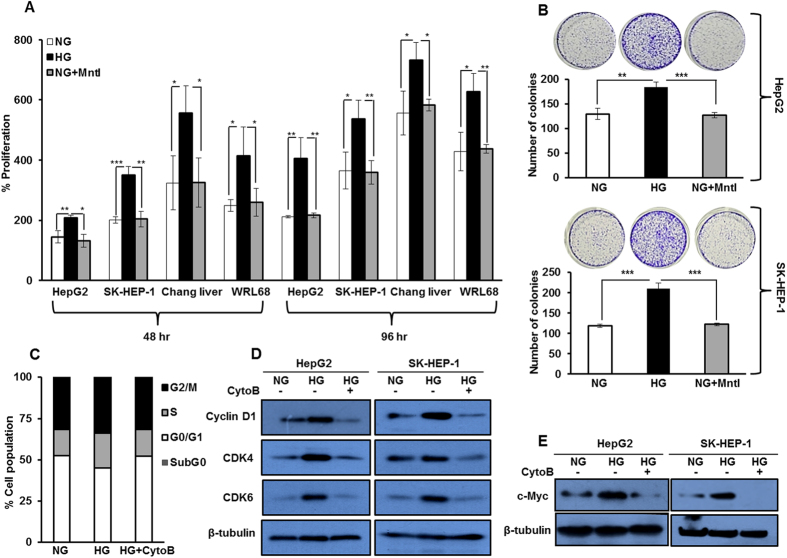
Figure 1. Glucose enhances proliferation in hepatocellular carcinoma cell lines.
(A) HCC cells (HepG2, SK-HEP-1, Chang liver and WRL 68) were cultured in HG and NG conditions for 48 hr and 96 hr. Thereafter, percent proliferation was determined by MTT assay. Mannitol (Mntl) treated NG conditions served as an osmolarity control. (B) HCC cells were cultured in NG, NG + Mntl and HG, and colonies were visualized by crystal violet stain and counted after 21 days. (C) Cell cycle profile of HepG2 cells cultured in NG, HG and HG + CytoB for 16 hr. Bar graphs represent percentage of cells in different phases of cell cycle by flow cytometry of an experiment done in triplicate. (D,E) HepG2 cells were cultured in NG, HG and HG + CytoB for 16 hr and whole cell lysates were subjected to detection of Cyclin D1, CDK6, CDK4 and c-Myc by western blotting. All the bar graph represents the mean ± SD of an experiment done in triplicate (*P < 0.05, **P < 0.001, ***P < 0.0001). Cropped blots are used in the main figure and full length blots are included in Supplementary Figure 6.

