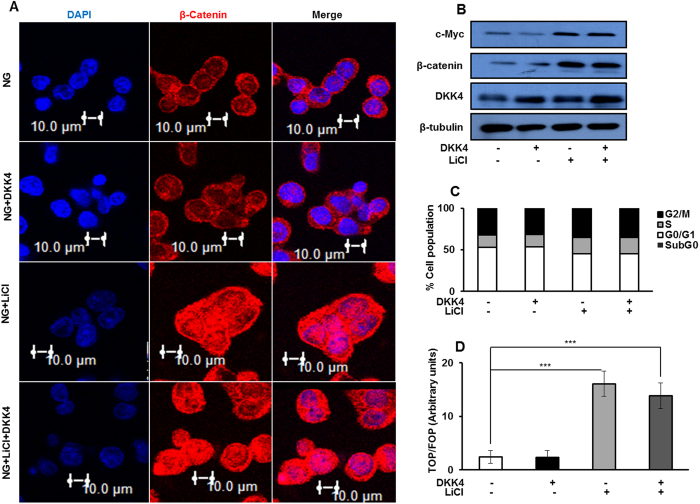
Figure 5. β-catenin stabilization in NG reverses effect of DKK4.
(A) Immunofluorosence based confocal imaging of β–catenin protein in HepG2 cells cultured under indicated conditions for 16 hr. Bars represent 10 μm. (B) Immunoblotting for DKK4, β-catenin and c-Myc in HepG2 cells cultured in NG, NG + LiCl, NG + DKK4 and NG + LiCl + DKK4 protein, for 16 hr. Cropped blots are used in the main figure and full length blots are included in Supplementary Figure 9. (C) Cell cycle profile of HepG2 cells cultured in NG, NG + LiCl, NG + DKK4 and NG + LiCl + DKK4 protein, for 16 hr. Bar graphs represent percentage of cells in different phases of cell cycle by flow cytometry. (D) TCF reporter activity assay in HepG2 cells cultured in NG, NG + LiCl, NG + DKK4 and NG + LiCl + DKK4, protein for 16 hr. The luciferase intensities were normalized with Renilla intensities and data is represented as ratio of TOP/FOP. Bar graphs represent mean ± SE of three independent experiments (*P < 0.05, **P < 0.001, ***P < 0.0001).

