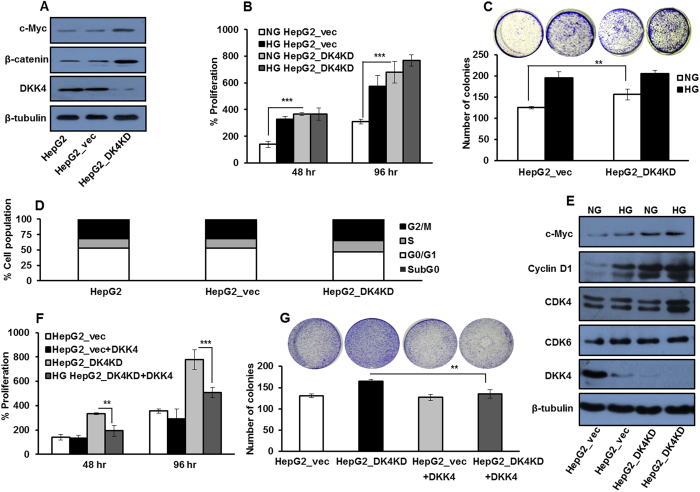
Figure 7. DKK4 affects glucose induced proliferation in HCC.
(A) HepG2, HepG2_vec and HepG2_DK4KD cells were cultured in NG for 16 hr and western blotting was performed to detect protein levels of c-Myc, DKK4 and β–catenin. (B) HepG2_vec and HepG2_D4KD cells were cultured in NG and HG for 48 hr and 96 hr. Percentage cell proliferation was determined by MTT assay. (C) HepG2_vec and HepG2_D4KD cells were cultured in NG and HG and colonies were visualized by crystal violet stain and counted after 21 days. All the bar graphs represent the mean ± SD of an experiment done in triplicate (*P < 0.05, **P < 0.001, ***P < 0.0001). (D) Cell cycle profile of HepG2_vec and HepG2_D4KD cells cultured in NG for 16 hr. Bar graph represents percentage of cells in different phases of cell cycle by flow cytometry. (E) HepG2_vec and HepG2_D4KD cells were cultured in NG and HG for 16 hr and whole cell lysates were subjected to detection of c-Myc, Cyclin D1, CDK6, CDK4 and DKK4 proteins by western blotting. (F) HepG2_D4KD and HepG2_vec cells were cultured in NG and NG + DKK4 protein, for 48 hr and 96 hr. Thereafter, percentage cell proliferation was determined by MTT assay. (G) HepG2_D4KD and HepG2_vec cells were cultured in NG and NG + DKK4 protein. Colonies were visualized by crystal violet stain and counted after 21 days. All the bar graphs represent the mean ± SD of an experiment done in triplicate (*P < 0.05, **P < 0.001, ***P < 0.0001). Cropped blots are used in the main figure and full length blots are included in Supplementary Figure 10.

