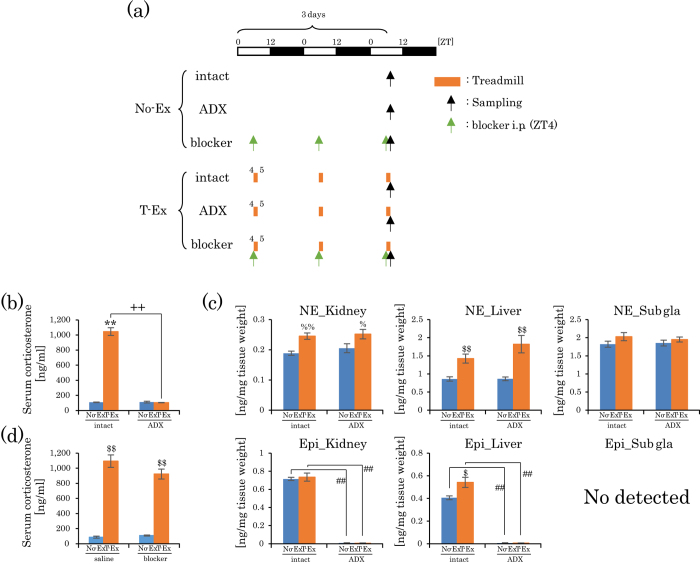
Figure 5. Increase in NE levels by treadmill exercise in ADX mice and increase in corticosterone levels by treadmill exercise in adrenergic blocker-treated mice.
(a) Experimental schedule. The white and black bars indicate environmental 12 h light and dark conditions. The orange short bar indicates exercise periods. The black and green arrows indicate the sampling time and blocker injection time, respectively. (b) Serum corticosterone level after 3 days of treadmill exercise in intact and ADX mice. Data (b) are represented as mean ± SEM (intact No-Ex, n = 4; intact T-Ex, n = 4; ADX No-Ex, n = 7; ADX T-Ex, n = 4). (c) NE and epinephrine levels in the kidney, liver and Sub gla after 3 days of treadmill exercise in intact and ADX mice. Data (c) is presented as mean ± SEM (intact No-Ex, n = 8; intact T-Ex, n = 8; ADX No-Ex, n = 7; ADX T-Ex, n = 9). (d) Serum corticosterone levels after 3 days of treadmill exercise in intact saline or adrenergic receptor blocker-treated mice. Data (d) is represented as mean ± SEM (saline No-Ex, n = 6; saline T-Ex, n = 6; blocker No-Ex, n = 6; blocker T-Ex, n = 6). **p < 0.01 versus No-Ex at same condition (intact or ADX), evaluated using the two-way ANOVA test with Tukey post-hoc test.++p < 0.01 versus intact at the same exercise condition (No-Ex or T-Ex), evaluated using the two-way ANOVA test with Tukey post-hoc test. %p < 0.01 %p < 0.05 versus No-Ex under the same conditions (intact or ADX), evaluated using the two-way ANOVA test with Sidak post-hoc test. $$p < 0.01 $p < 0.05 versus No-Ex at same condition (intact or ADX), evaluated using the Mann-Whitney test. ##p < 0.01 versus intact under the same exercise condition (No-Ex or T-Ex), evaluated using the Mann-Whitney test. No exercise or treadmill exercise: No-Ex or T-Ex, respectively.

