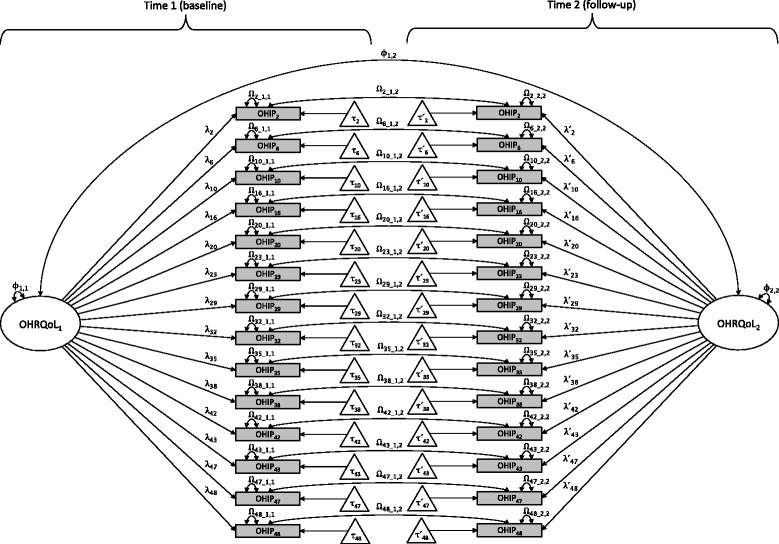
Fig. 1.

One-factor model for OHRQoL assessed with 14-item OHIP at two occasions; Note: rectangles represent items (i.e., measured or observed variables [OHIP2 – OHIP48]), ovals reflect latent common factors [OHRQoL1 and OHRQoL2], triangles indicate intercepts [τ2 − τ48 and τ´ 2 − τ´ 48], unidirectional arrows illustrate directional links (i.e., values of regression parameters for factor loadings [λ2 − λ48 and λ´ 2 − λ´ 48] and intercepts), and bidirectional arrows illustrate common factor variances [Φ 1,1 and Φ 2,2] and between-occasion factor covariance [Φ 1,2] as well as item residual variances [ Ω 2_1,1 − Ω 48_1,1 and Ω 2_2,2 − Ω 48_2,2] and covariances [Ω 2_1,2 − Ω 48_1,2]. For clarity, notation is slightly different than that used in the text
