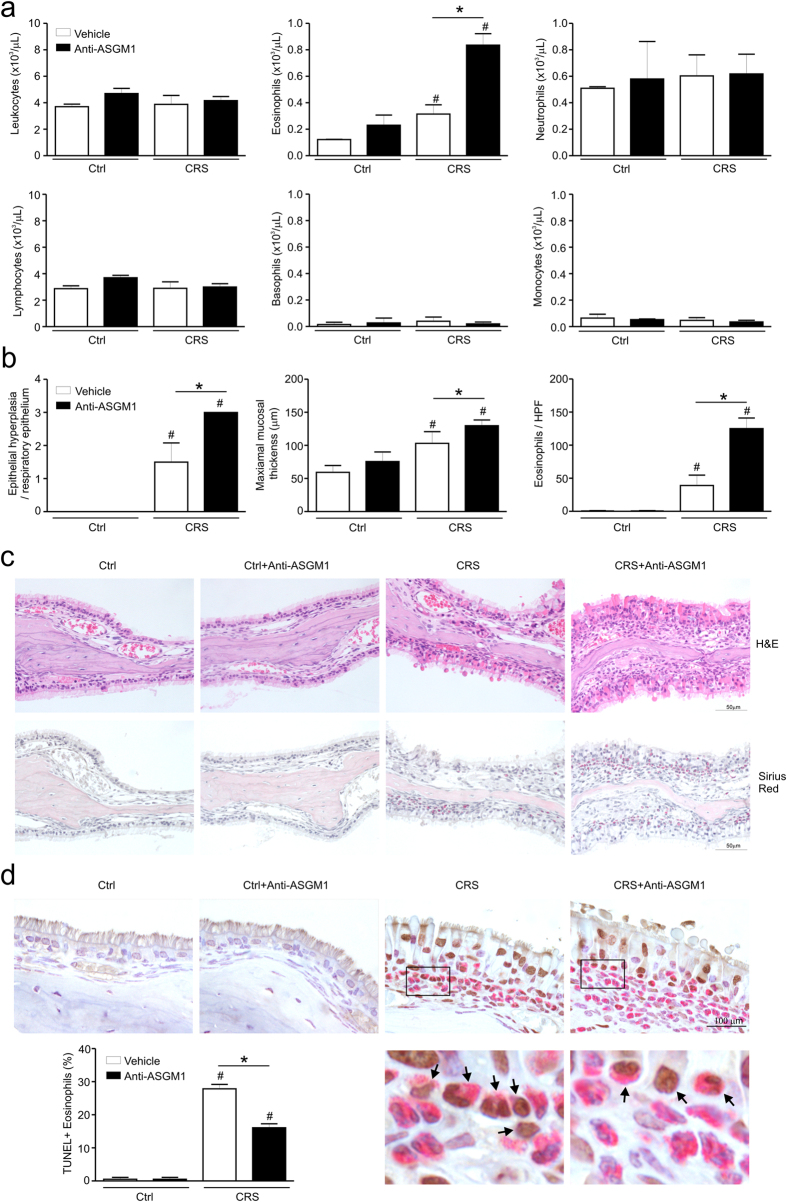
Figure 3. NK cells regulate eosinophilic inflammation in a murine model of CRS.
(a) Counts of leukocytes, eosinophils, neutrophils, lymphocyte, basophils, and monocytes in blood from each group of mice (n = 4). (b) Scores of epithelial hyperplasia (left), maximal mucosal thickness (middle) in hematoxylin and eosin-stained tissue sections, and eosinophil counts of the lamina propria (right) in Sirius red-stained tissue sections. (c) Representative photographs of hematoxylin and eosin (upper, original magnification x400) and Sirius red (lower, original magnification x400)-stained sections. (d) Representative photographs of TUNEL- and Sirius red-stained sections and quantitative analysis of TUNEL-positive eosinophils. The black box indicates the magnified area. Arrows denote TUNEL-positive eosinophils. Scale bars represent 100 μm. Statistical bar chart shows the percentage of TUNEL-positive cells relative to total eosinophils. Data are expressed as means ± SDs. *P < 0.05; #P < 0.05, Mann-Whitney U test (a,b,d).

