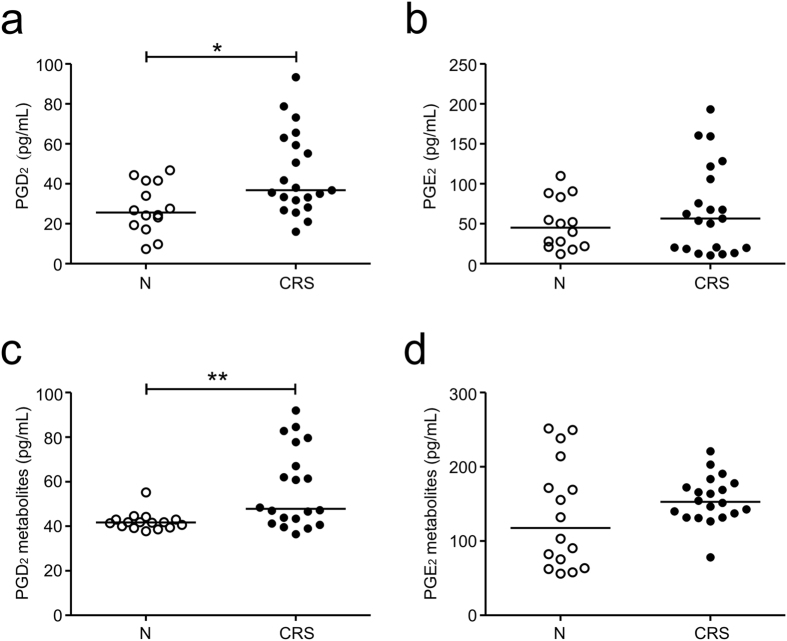
Figure 4. Patients with CRS have altered levels of PGD2.
(a,b) PGD2 (a) and PGE2 (b) levels in the serum from the controls (N) (n = 14) or patients with CRS (n = 21) were measured by using LC-MS/MS. (c,d) Levels of PGD2 metabolite (c) and PGE2 metabolite (d) in the serum from the controls (N) (n = 16) or patients with CRS (n = 20) were measured by using an enzyme immunoassay. Horizontal bars denote the medians. *P < 0.05; **P < 0.01, Mann-Whitney U test.

