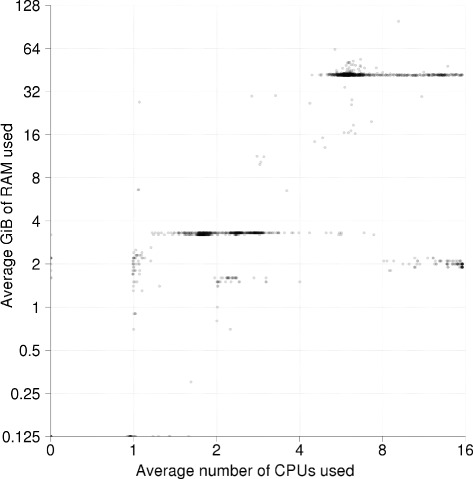
Fig. 3.

Average resource usage for the human whole genome sequencing pipeline at the National Genomics Infrastructure at SciLifeLab during the 6 month period May to October 2015. The pipeline consists of the GATK best practice variant calling workflow [33, 34] plus a number of quality control jobs. Each point in the figure is a job and the axes show the average number of CPUs and GiB RAM used by the corresponding job. The graph illustrates how this standard high-throughput production pipeline has a very clear resource usage pattern that does not achieve full CPU utilization on the 16 core nodes it runs on
