
Fig. 1.
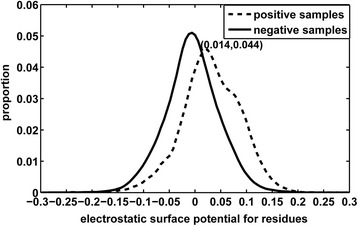
The distribution of electrostatic surface potentials for both positive (RNA-binding) and negative (non-RNA-binding) samples in RBP195, the cross point of the two distribution curves is at (0.014, 0.044)
Official websites use .gov
A
.gov website belongs to an official
government organization in the United States.
Secure .gov websites use HTTPS
A lock (
) or https:// means you've safely
connected to the .gov website. Share sensitive
information only on official, secure websites.
The distribution of electrostatic surface potentials for both positive (RNA-binding) and negative (non-RNA-binding) samples in RBP195, the cross point of the two distribution curves is at (0.014, 0.044)