
Fig. 2.
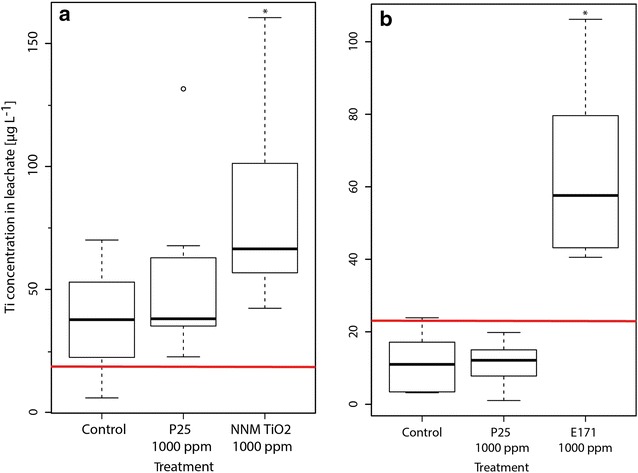
Boxplots (solid line = median) showing the Ti content of the leachates in the clover (a, each treatment n = 7) and wheat (b, each treatment n = 6) experiment. The LOQ is indicated with a solid red line. Significant difference (p < 0.05) of a treatment compared to the respective controls is indicated with an asterisk. The lower and upper borders of the boxes represent the 25th and 75th percentile, respectively. Whiskers represent maximum and minimum values, circles indicate outliers