
Fig. 3.
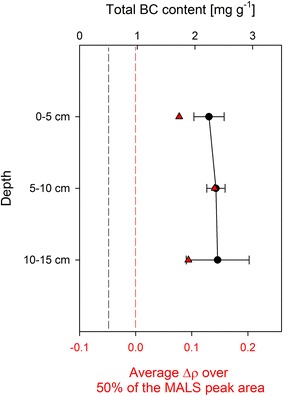
Vertical distribution of BC content in the red clover pots, determined by CTO-375 (black circles), and of Δρ values, indicative of the presence of MWCNT, determined by aF4-MALS (red triangles). The dashed black line shows the native BC content of the soil, while the dashed red line shows the MWCNT-free soil baseline in aF4-MALS (Δρ = 0). Error bars show the standard deviation of five replicates. Δρ values were determined once from pooled extracts of the five replicates