Fig. 1.

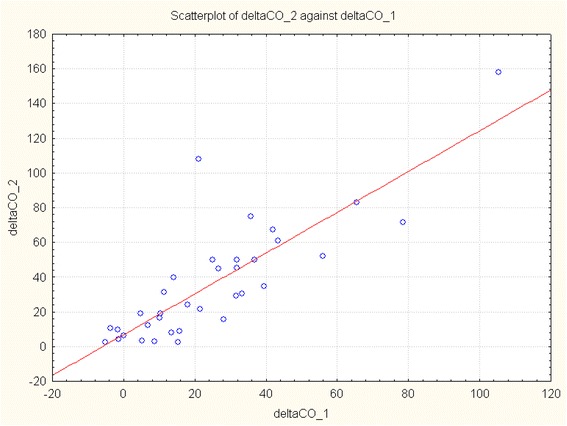
Scatterplot showing the correlation between change in cardiac output after passive leg raising (ΔCO_1) and that induced by volume expansion (ΔCO_2) (p = 0.000, r = 0.822)

Scatterplot showing the correlation between change in cardiac output after passive leg raising (ΔCO_1) and that induced by volume expansion (ΔCO_2) (p = 0.000, r = 0.822)