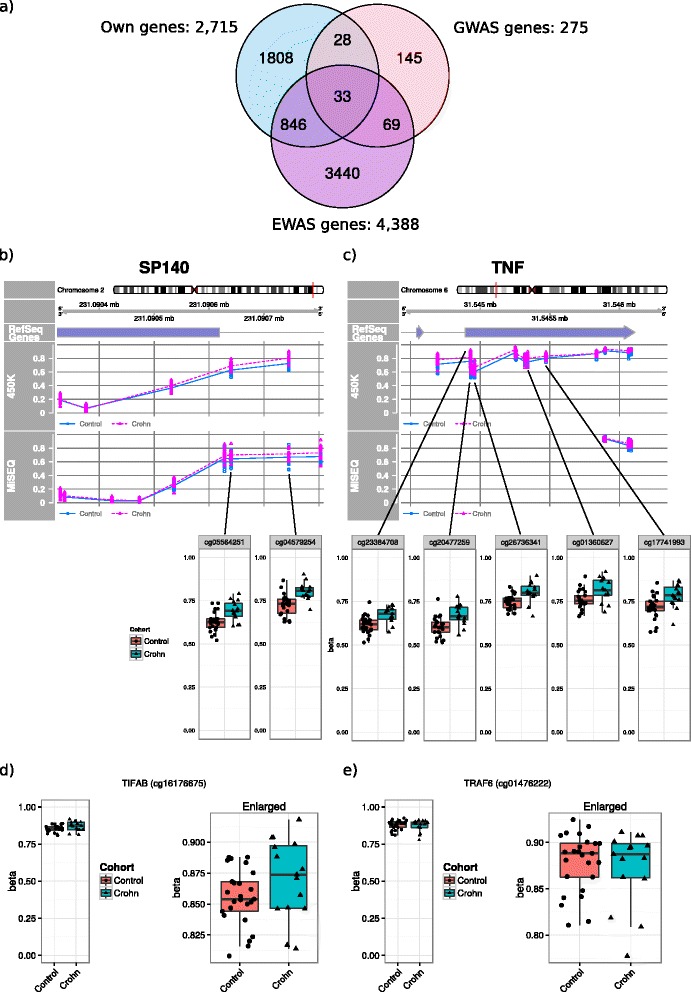
Fig. 5.

Hypothesis-driven differentially methylated positions. a Venn diagram representing the overlap between CD-associated genes from our data (2715 genes), GWAS data (275 genes), and EWAS data (4388 genes). Genomic plots of the methylation levels of the DMPs obtained from the 450k (“450K”) compared to the methylation levels obtained from MiSeq sequencing (“MiSEQ”) superposed on known RefSeq genes (“RefSeq gene”) for b SP140 and c TNF. Note that the MiSeq sequencing of SP140 missed one CpG covered by the 450k, which was specifically removed due to low read count (<100; see Section 5 “Illumina MiSeq Sequencing”). Enlarged dot-boxplots are provided for the significant CpGs associated to TNF: cg23384708, cg20477259, cg26736341, cg1360627, and cg17741993, and SP140: cg05564251 and cg04579254. Dot-boxplots of d cg16176675 (TIFAB) and e cg01476222 (TRAF6), as reported from McDermott et al.
