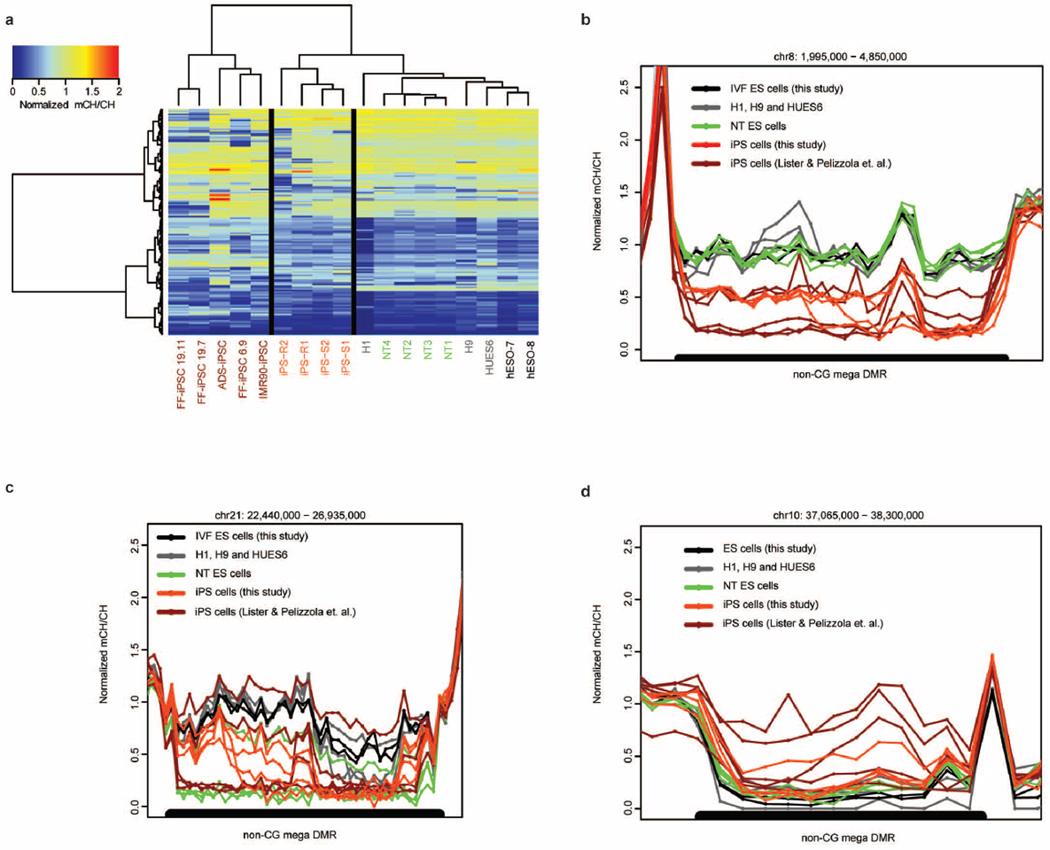
Extended Data Figure 7. Non-CG mega DMRs.
a, Heat map of normalized mCH/CH of all 150 non-CG mega DMRs identified by comparing four NT ES cell lines, nine iPS cell lies to five IVF ES cell lines from this study and the previous studies28–30. b, An example of non-CG mega DMRs (black bar) ranged from 1,995,000 bp to 4,850,000 bp on chromosome 8. The y axis is normalized mCH/CH, which is defined as the weighted non-CG methylation level minus bisulphite non-conversion and dividing median mCH/CH of 5 kb bin. Scope was extended 200 kb on both sides to show non-CG methylation profile of regions surrounding non-CG mega DMRs. c, A representative non-CG mega DMR (black bar) hypomethylated in both iPS cells and NT ES cells on chromosome 21. d, A representative non-CG mega DMR hypermethylated only in iPS cells on chromosome 10.

